← 判读档案
2026-08-02

美股七月赚钱了吗?这里面或许有你想要的答案:7月收官 & 回顾

这是往期归档。当日判读全文只在盘前送进订户邮箱:订阅后每个交易日开盘前送达。
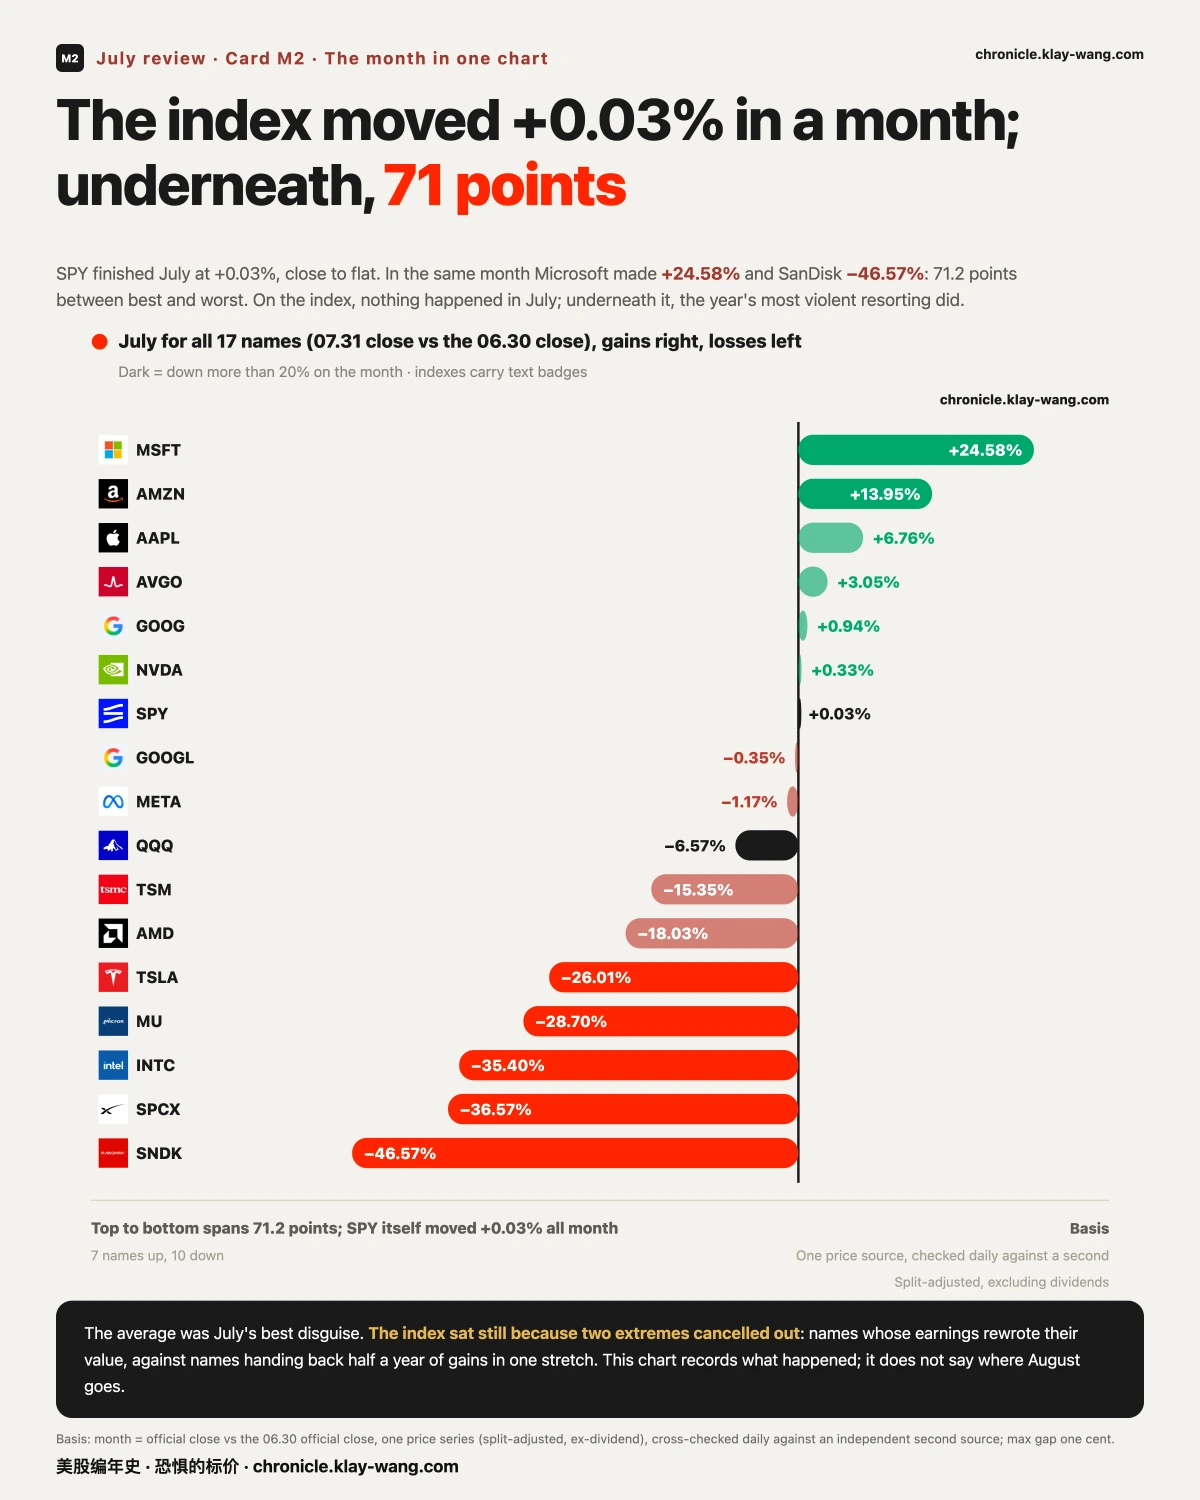
七月标普 ETF 收 +0.03%,一个月,几乎一分没动。同一个月里微软 +24.58%、闪迪 −46.57%最高与最低之间隔着 71.2 个百分点
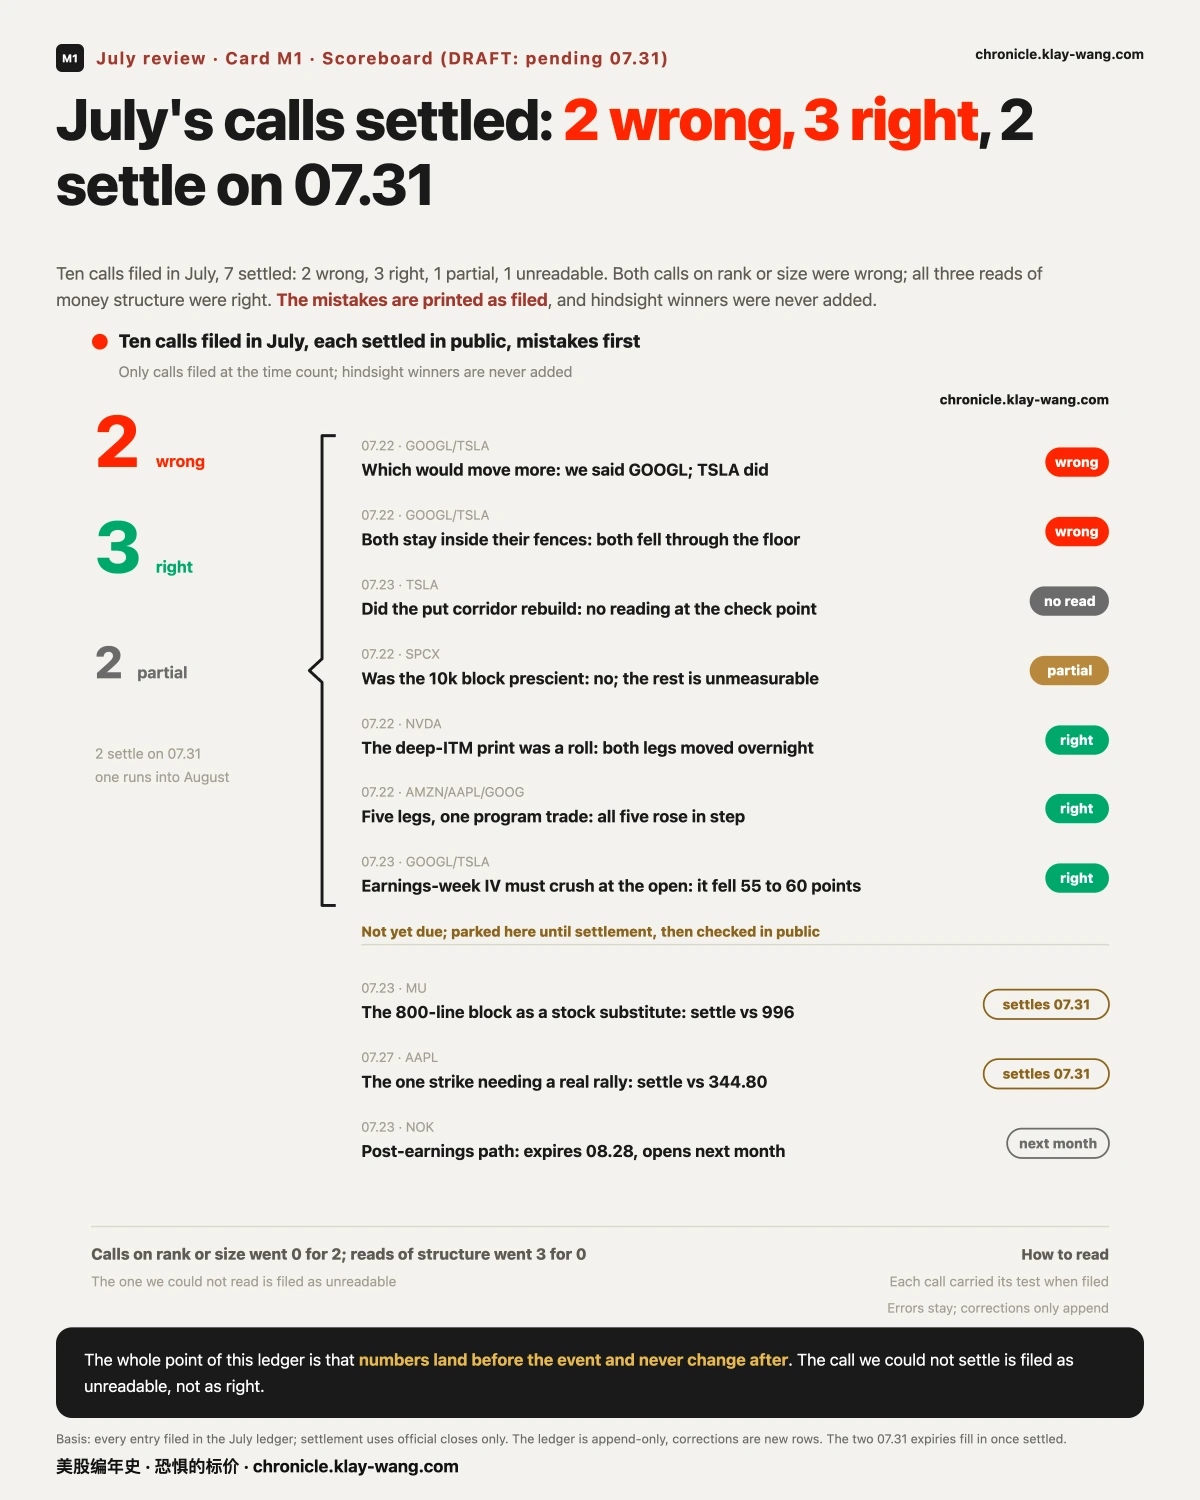
我们记录的判断逐条开奖:押座次和幅度的两条全错,读资金结构的三条全对;另有两条我们答不出来,原样写无法判定
四道财报围栏结算 三出一内;月末最后两天,30 年期与 10 年期美债的利差走阔到 55 个基点,是七月最高

一、七月的最后一天,是这个月的缩影

07.31 收盘,标普 ETF 报 747.03,全月 +0.03%。一个月,指数回到了它出发的地方。

而这一天的盘中是这样的:开盘五分钟,它冲到距自己伽马翻转位 0.31 点的地方被拒;接下来四十分钟跌掉 8.6 点,连破昨收、看跌密集峰 743、看跌墙 740;午后又全部收回,收在翻转位上方。当天早上那份宏观数据落地时,它只动了 0.6 点。

收盘价什么也没说,中间发生的一切才是这个月的内容。指数只告诉你平均发生了什么,它从不告诉你发生在谁身上。
卡1_七月记分牌_EN

二、七月记分牌:先报错的

我们记录的这些交易日里,逐条立案、逐条开奖。

错的两条,错在同一个地方:财报夜押谁动得大:我们押了谷歌,动得大的是特斯拉;押两家都不会走出各自的波动围栏:结果双双跌穿下沿,围栏根本不够宽。两条都是在猜幅度和名次。

对的三条,也对在同一个地方:英伟达那笔深度价内大单是移仓不是新押注(次日两条腿的隔夜持仓一起动,坐实);横跨三只票的五条腿是同一笔程序单(五腿隔夜齐增);财报周当周到期的保险价开盘必然塌(塌了 55 到 60 个波动点)。三条都是在读资金留下的结构。

还有两条我们答不出来。七月最后一天,英特尔那组四腿和美光那七档看涨阶梯到期,而它们的隔夜持仓查不到了:当日到期合约只有一个采集窗口,我们的轮次没覆盖上。这两条的结论是无法判定,不是没成立。教训已经立档:埋在当日到期合约上的开奖,动作必须排进当天的轮次。

模式干净得有点刺眼:猜价格往哪走、猜谁动得大,0 对 2;看懂这笔钱在干什么,3 对 0。我们不猜牌,我们看筹码。

记录的价值全在于事前落库、事后不改;一旦允许自己回头修,整本账就一文不值。记分牌上的每一个错,都是在给对的那几条背书。
卡2_七月全月_EN

三、一个一动不动的指数,和它底下的 71 个百分点

全月 17 只标的,7 只上涨、10 只下跌。上面是微软 +24.58%、亚马逊 +13.95%、苹果 +6.76%;下面是闪迪 −46.57%、SPCX −36.57%、英特尔 −35.40%、美光 −28.70%、特斯拉 −26.01%;中间是标普 ETF +0.03%、纳指 ETF −6.57%、英伟达 +0.33%

最高与最低差 71.2 个百分点,而指数本身一个月只走了 0.03%:这不是指数没事、个股有事,是两边的极端恰好抵掉了。一边是财报直接改写市值的(微软一天多出四千五百亿美元,有记录以来最大的单日增量);一边是把上半年涨幅整段还回去的。

存储那两只的背景值得单独说一句,因为它很容易被误读:闪迪在过去 52 周里从 40 涨到 2354,58 倍。所以这个月的 −46.57%,是从天上下来,不是被错杀。我们只记录它走过的位置,不评价它该在哪。

一个 +0.03% 的月份里,有人赚了四分之一,有人少了将近一半。指数只告诉你平均发生了什么。

四、三个镜头看七月

价格:这是墙与位置的一个月。 07.17 月度到期日,看涨与看跌的密集价位塌缩成一根针:谷歌的现价、两道墙、翻转位、最大痛点全部挤在 1.4 点之内。07.20 重置,墙位整个重排。07.29 联储决议。财报周把伽马地图连夜重画:纳指 ETF 的翻转位一夜下移 33.5 点,美光下移 96.5 点。到 07.31,苹果收在自家看跌密集价位下方,亚马逊冲破自家看涨密集价位 16 点。整月里价格与它自己那道墙的关系反复兑现,不是因为墙有魔力,而是因为那些价位上真的堆着钱,堆得够多,价格路过时就会被拽一下。墙会移,而且每个到期日之后必须整个重读。

资金:我们记下的,和后来发生的。 07.20 清晨有人用一万二千美元买了三千张四美分的深度崩盘保险,一笔打完、全天再无加仓;07.22 美光 800 线的一亿美元大单;07.23 英伟达的深度价内移仓,次日坐实;07.30 英特尔的四腿结构与标普 09.04 到期的两侧新单:最后这笔在 07.31 开出了七月最干净的一个对照:同一天、同一个到期日,看跌那侧六成的量留仓过夜,看涨那侧只留下 8.7%。 而那个到期日,钉在八月非农那一天。四美分的保险后来没有用上;移仓的判断被数据坐实;两笔到期日的开奖我们查不到,就写查不到。能被检验,是这本账唯一的护城河。
卡3_温度计弧线_EN

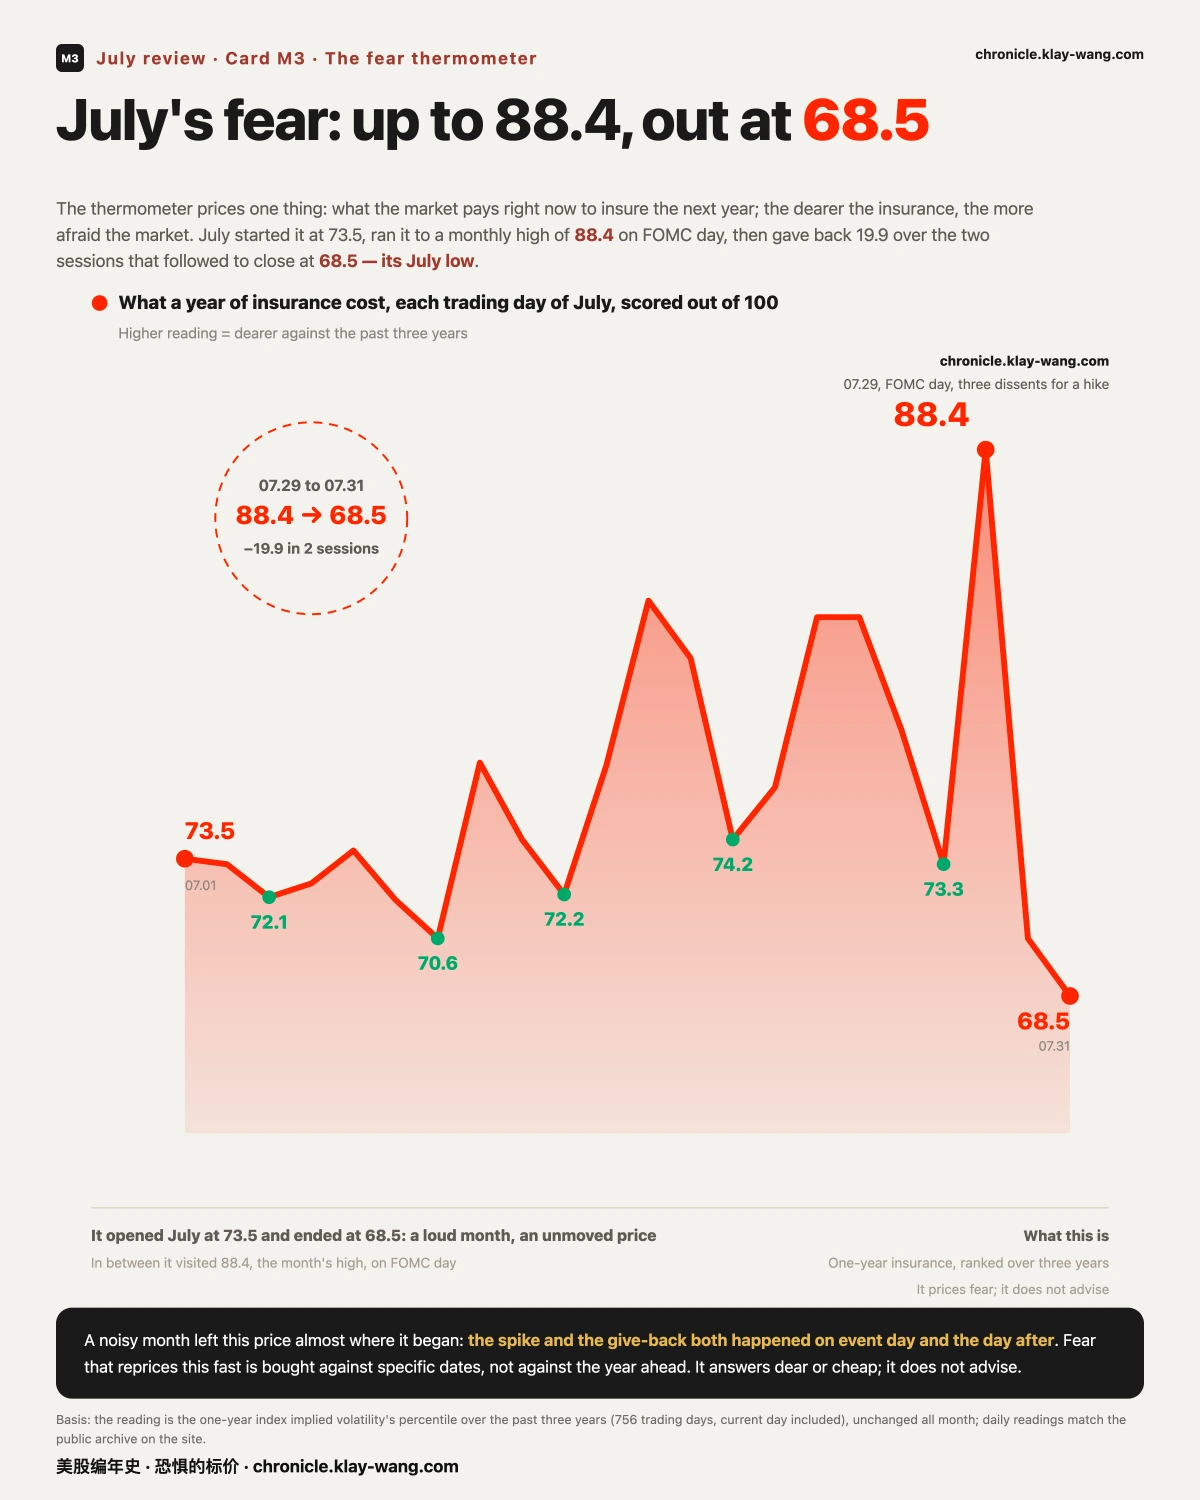
恐惧:从 73.5 到 88.4,再到 68.5。 为未来一年买保险的价钱,七月从 73.5 出发,07.10 落到 70.6,07.17 到期日冲到 82.9,联储决议那天冲到全月最高 88.4,随后两个交易日回吐 19.9,最后一个交易日收在 68.5:全月最低。一个月吵完,这份怕收在了比月初更便宜的地方;而冲高和回落都发生在事件的当天和第二天。保险贵起来快、便宜回去也快,说明七月买的怕是对着具体日子买的,不是对着未来一年。
卡4_围栏结算_EN

五、四道围栏的结算:三出一内,和一个必须说的反转

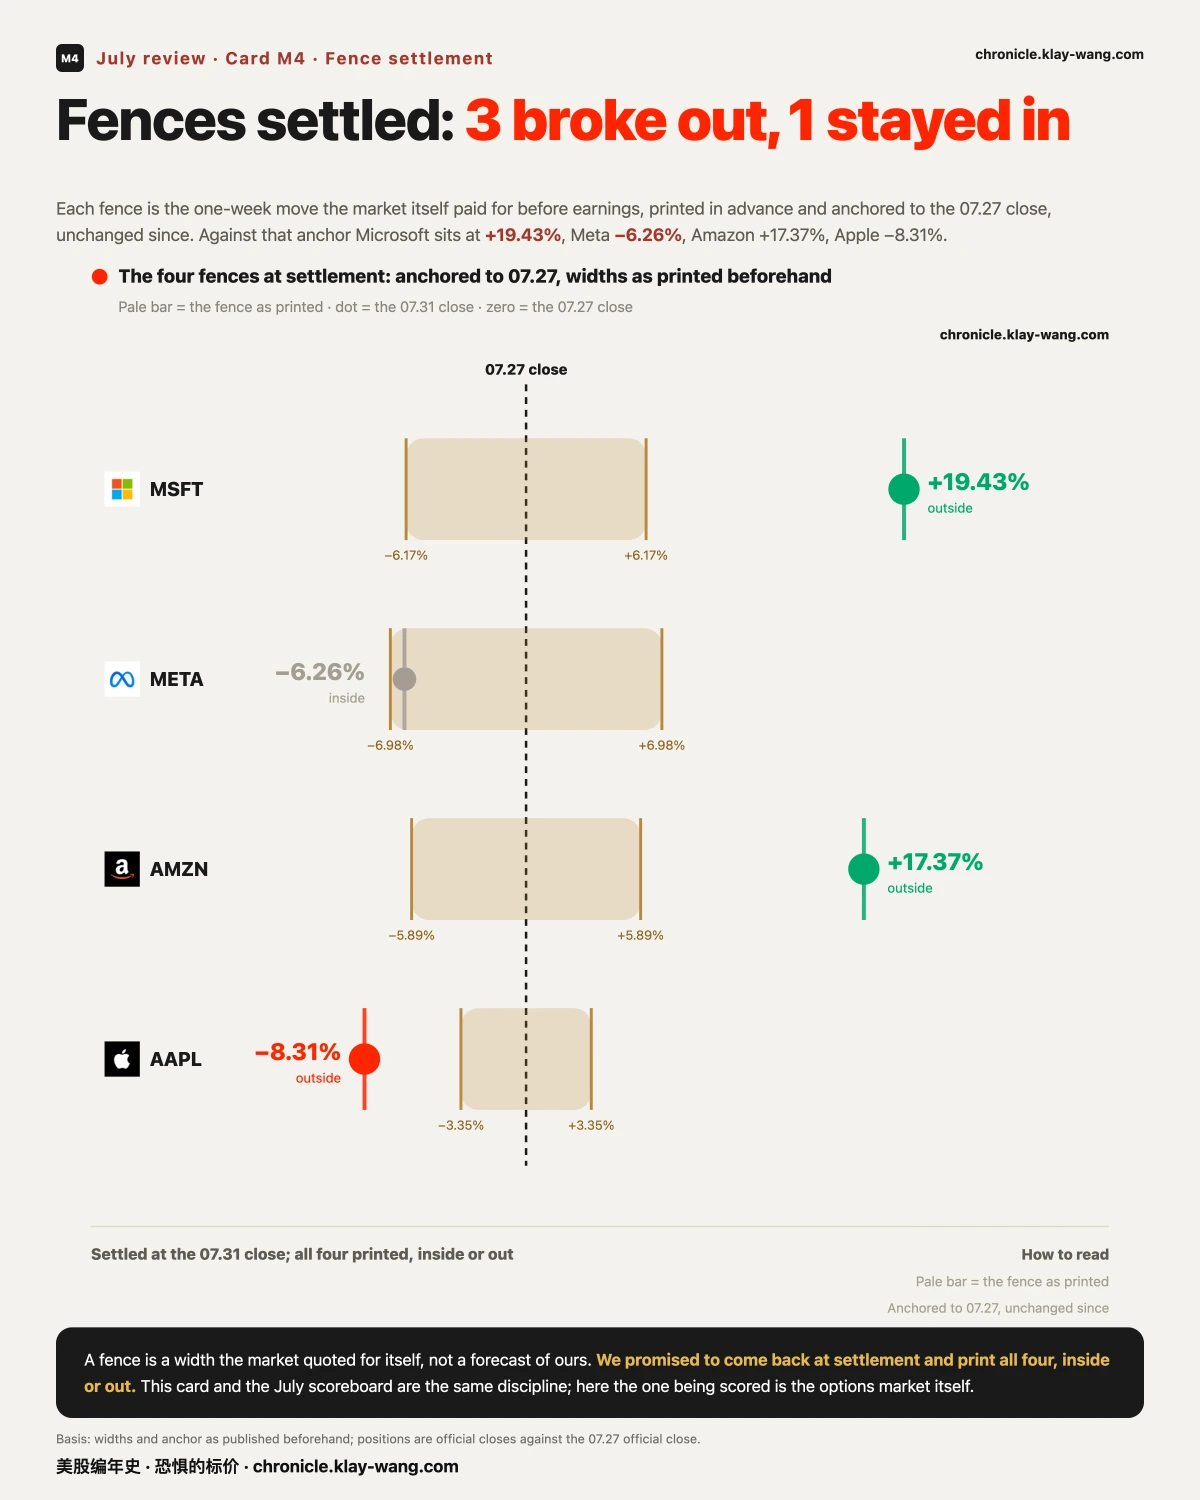
财报前,市场自己用真金白银给四家标出了一周的波动宽度,我们在事前原样印出、锚定 07.27 收盘、事后一字未改。07.31 收盘结算:微软 +19.43%(栏 ±6.17%,出栏)、亚马逊 +17.37%(±5.89%,出栏)、苹果 −8.31%(±3.35%,出栏)、Meta −6.26%(±6.98%,栏内)。

三只走出了市场事前为它们画的宽度:这一轮财报的幅度被系统性低估了。

但真正该记住的是 Meta:07.30 我们印过它已经出栏(当时 −9.23%),而结算日它回到了栏内。 那个中途读数没有错,它只是不是结论。这和我们这个月在联储决议日做的六点采样是同一件事:同一天的保险价,你取哪个时点,可以得出三个互相矛盾但都真实的结论。所以主序列锚收盘,不是因为收盘更准,而是因为它是唯一一个不需要我们挑选的点。

中途读数只告诉你那一刻,从不告诉你结局。

六、月末最后两天,债市那边动了

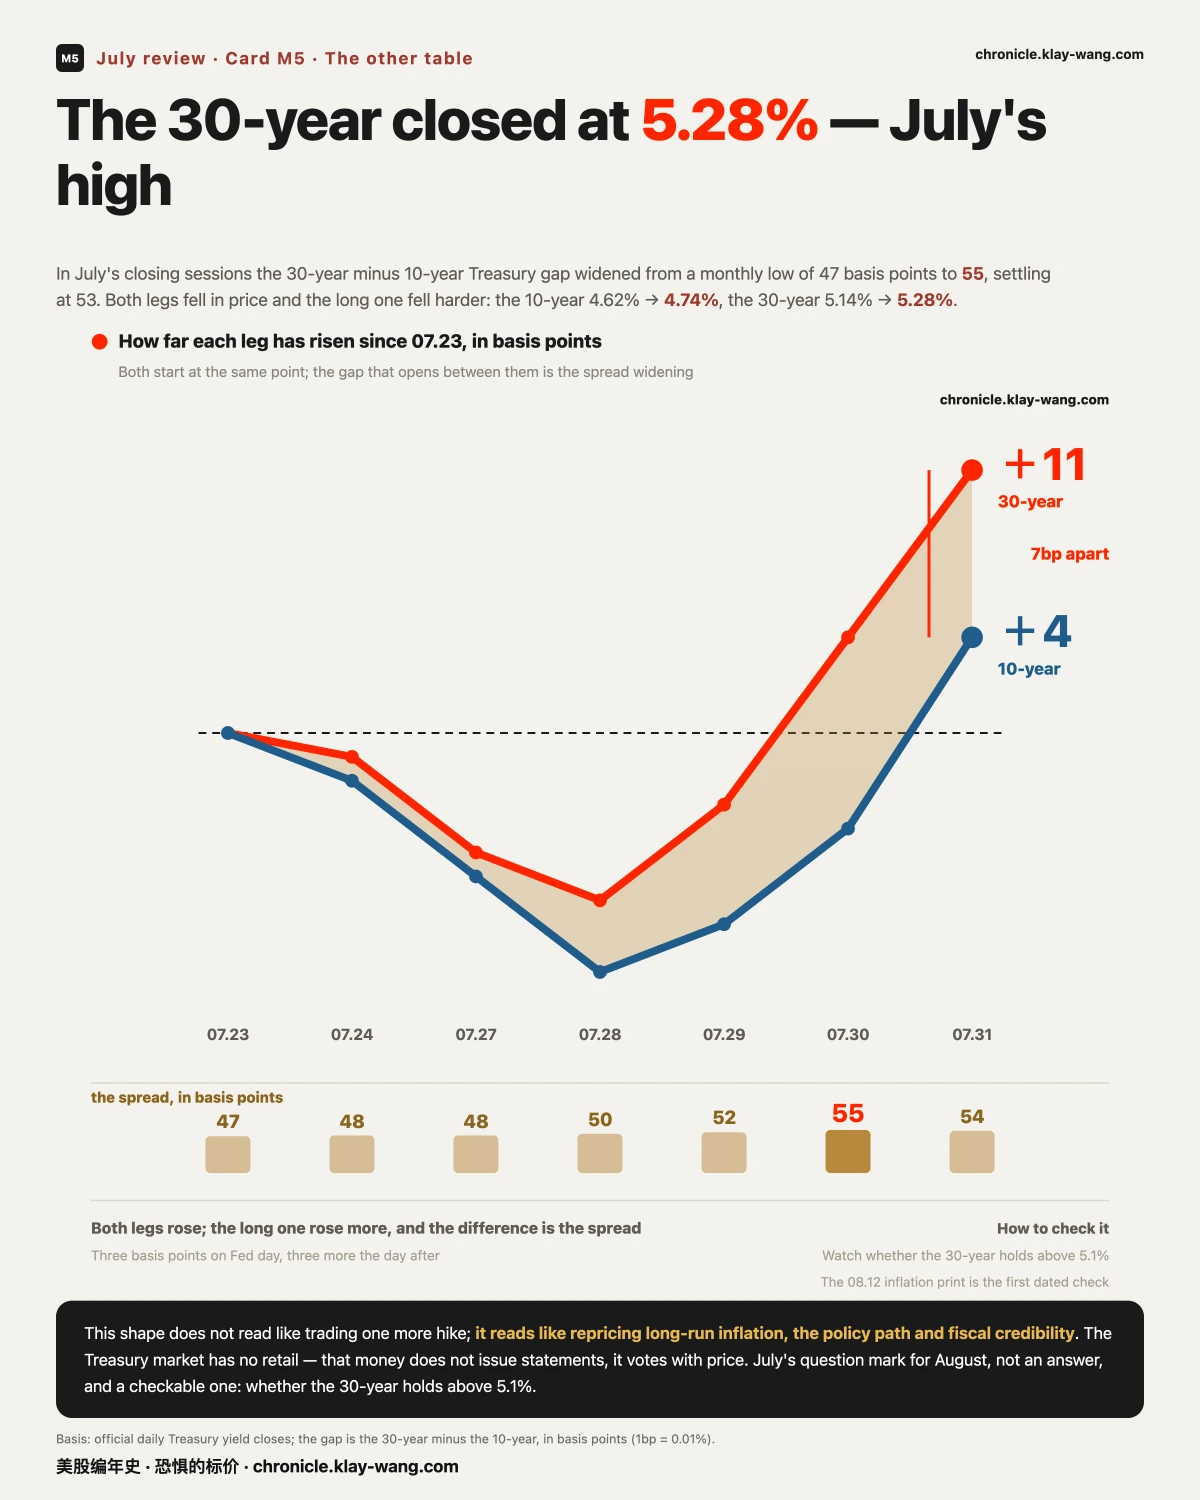
去杠杆解决的只是资金的问题;反弹能走多远,要看的是另一张桌子。而七月最后两天,那张桌子上有一个可查的变化:30 年期与 10 年期美债的收益率利差,从月内最低的 47 个基点走阔到 55 个基点,其中联储决议当天 +3 个基点、第二天再 +3 个基点;月末最后一天小幅收窄到 53 个基点,但两条腿双双再上台阶(10 年期 4.74%、30 年期 5.28%,均为七月最高)。

拆开两条腿看:07.29 到 07.31,10 年期从 4.62% 升到 4.74%,30 年期从 5.14% 升到 5.28%:两条腿都在跌价,而长端跌得更狠,利差因此从 47 个基点的月内低点走阔。这个形状不是在交易短期还会不会加息,它更像在给长期通胀、政策路径与财政可信度重新定价。
卡5_债市利差_EN

市场上有个说法叫债市义警:债券市场没有散户,全是机构的钱;当这批钱对政策不满意,它们不发声明,它们用价格表态。某种意义上,债市正在替联储做一部分收紧金融条件的工作:而这件事从来不问股票同不同意。

这一段是七月给八月留下的问号,不是答案。它可以被检验:七月最后三个交易日,30 年期已经连续三天收在 5.1% 上方、最后一天到 5.28%。如果这个位置继续抬升,这条逆风就还在账上;如果退回 5.0% 下方,这一段就翻篇了。08.12 的通胀数据和八月的长债标售,是接下来两个可查的时点。

而七月苦了一整个月,最后一周终于给了一段像样的反弹:这句话和上面那段并不矛盾,它们只是两张不同的桌子。

七、我们说过的那些话,后来怎么样了

不是为了邀功,是为了让你能检验:一本账值不值钱,取决于它敢不敢让你回头翻。

07.27 我们写过一句市场追的是英伟达的信用故事,不是存储的供给故事。 那天它只是当日的一个观察。到月末:英伟达全月 +0.33%,而存储那两只是 −28.70%−46.57%。两个故事被定成了完全不同的价,这个分野走完了整个七月。

07.25 我们写过存储跌了三成,上车的票反而更贵了。 那句话的重点不是方向,是一个当时可测的事实:正股在跌,而它的保险价在涨。到月末,存储又跌了一大截,而它们的长端保险价仍然是全宇宙最高的一档(闪迪一年期读数 106.51,是标普的五倍多)。跌不便宜,是七月存储最稳定的一个特征。

07.23 我们写过谷歌 CFO 还没念出数字,存储股的期权已经把剧本演完了。 后来资本开支确实成了整月的主线之一。

也有没兑现的:07.20 那张四美分的崩盘保险,到七月结束一次都没用上。 我们当时只写了有人付了这个价,没说它会赢:这也是为什么现在不用改口。

07.22 我们记的美光 800 线一亿美元大单,07.31 到期,收盘 823.03,远低于保本线 996。 这一笔的结局是亏的,我们照记。

八、三个还没有答案的问题(依据 → 推理 → 推翻条件)

关于大盘:一个不动的指数,是平静还是拉锯?
依据:七月标普 ETF +0.03%,而 17 只成分里最高与最低差 71.2 个百分点;同期为未来一年买保险的价钱从 73.5 到 88.4 再到 68.5。推理:如果是平静,指数不动、成分也不该散成这样;如果是拉锯,就应该看到成分剧烈重排而指数被抵消:七月是后者。所以七月市场很稳这句话,在指数层面成立,在成分层面不成立。推翻条件:八月如果成分差距收窄到 30 个百分点以内而指数继续横着,那才是真的平静。

关于科技内部:是轮动,还是分化?
先说我们不能说的:轮动意味着钱从 A 流向了 B,而这需要资金流向数据:我们没有,所以我们从不用这个词。 我们能测的是分化:同一天里,微软几乎平开、涨幅 3.27% 全部产生在盘中、收在当日区间的 88% 位置;而超微与英特尔收在当日区间的最低 1%。同一个板块,同一天,两种完全相反的日内形状。月度上更极端:微软 +24.58%、英特尔 −35.40%,同属科技。推理:能确认的是同一个标签下的资产已经不再一起走;不能确认的是钱有没有从一边搬到另一边。推翻条件:如果八月这些票重新开始同涨同跌(日度相关性回升),分化这个描述就该收回。

关于存储:这是死猫跳,还是反转?
这个问题我们不回答方向,但可以把它拆成可查的坐标。依据:闪迪 52 周从 40 到 2354(58 倍),七月 −46.57%,距历史最高回撤 48.40%;美光七月 −28.70%。而 07.31 这天它们的日内形状是高开被卖:闪迪开盘时还涨 8.10%,从开盘算跌 12.20%;美光跳空 +5.18%,从开盘算跌 10.54%,两只都收在当日区间的低位。推理:跳空是隔夜给的,盘中是当天卖的:这两件事的参与者不是同一批人,而只看全天跌幅会把这个区别抹掉。同时,07.31 有人在美光今天这根阴线里,为 1000 线的看涨期权付了 517 万美元(vol/OI 3.66,是当天新建的仓)。推翻条件:不看方向,看两件事:其一,跳空与盘中是否重新同号(连续几天高开高走或低开低走,说明隔夜与日内的人看法一致了);其二,长端保险价是否回落(闪迪一年期读数从 106.51 往下走,说明市场不再为它的不确定性付这么高的价)。这两件事我们每天都在记,到时候回来对。

九、信用故事讲完了,那存储呢:把七月的钱和八月的位置摆在一起

七月我们写过一句市场追的是英伟达的信用故事,不是存储的供给故事。一个月过去,这句话的两半走成了两个极端:英伟达全月 +0.33%,存储那两只是 −28.70%−46.57%。信用故事的定价没变,供给故事的定价崩了。

但真正值得留到八月的,不是这个结论,是钱在崩的过程里做了三件互相矛盾的事

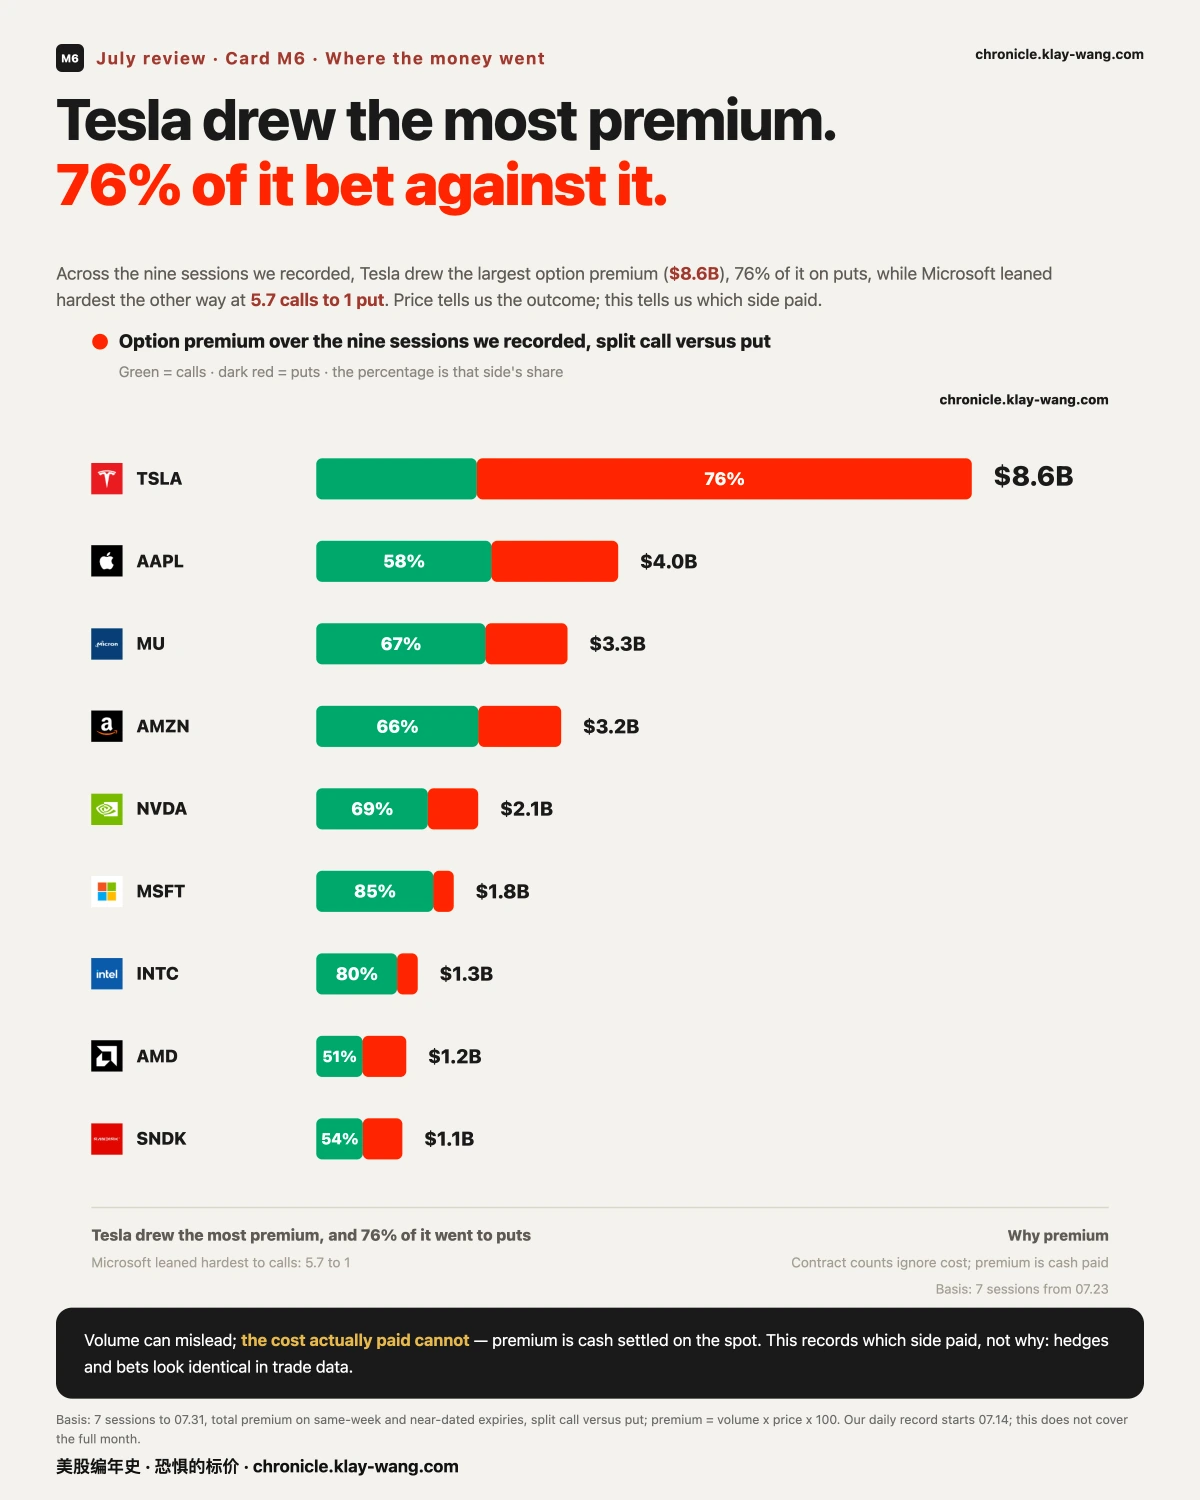
卡6_七月钱押在哪_EN

第一件:短打的钱在美光身上是偏看涨的。 我们记录的这九个交易日,美光的期权权利金 33 亿美元排全场第三,其中 67% 付在看涨一侧:而它同期跌了 28.70%。这不是有人在抄底(成交数据看不出谁买谁卖),但它至少说明:跌的过程中,付钱的人并没有一边倒地站在下跌那一侧

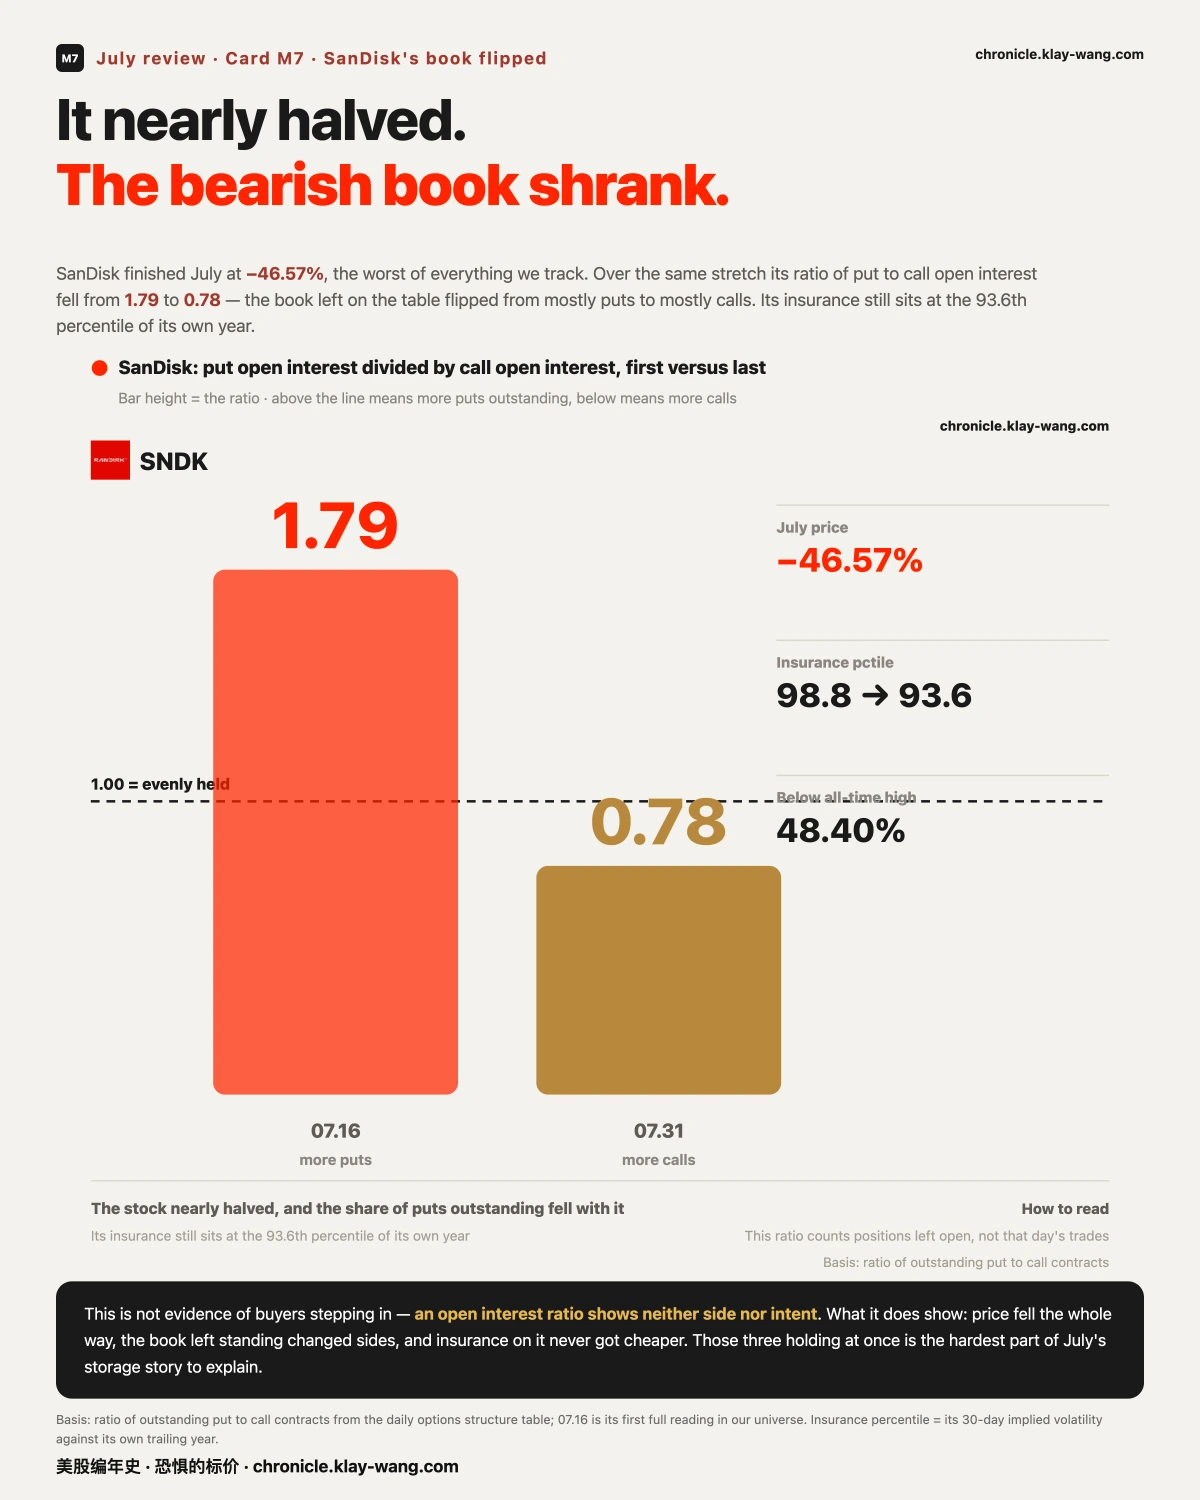
卡7_闪迪持仓翻面_EN

第二件:闪迪的留仓换了侧。 看跌与看涨的未平仓比从 1.79 掉到 0.78,留在场上的仓从看跌为主变成了看涨为主,而同期股价近乎腰斩、保险价仍在自己一年的 93.6 分位。跌了一半、赌跌的持仓反而少了、保险还是最贵的一档,这三件事同时成立,是七月存储最难解释的一段。
卡8_长钱在哪_EN

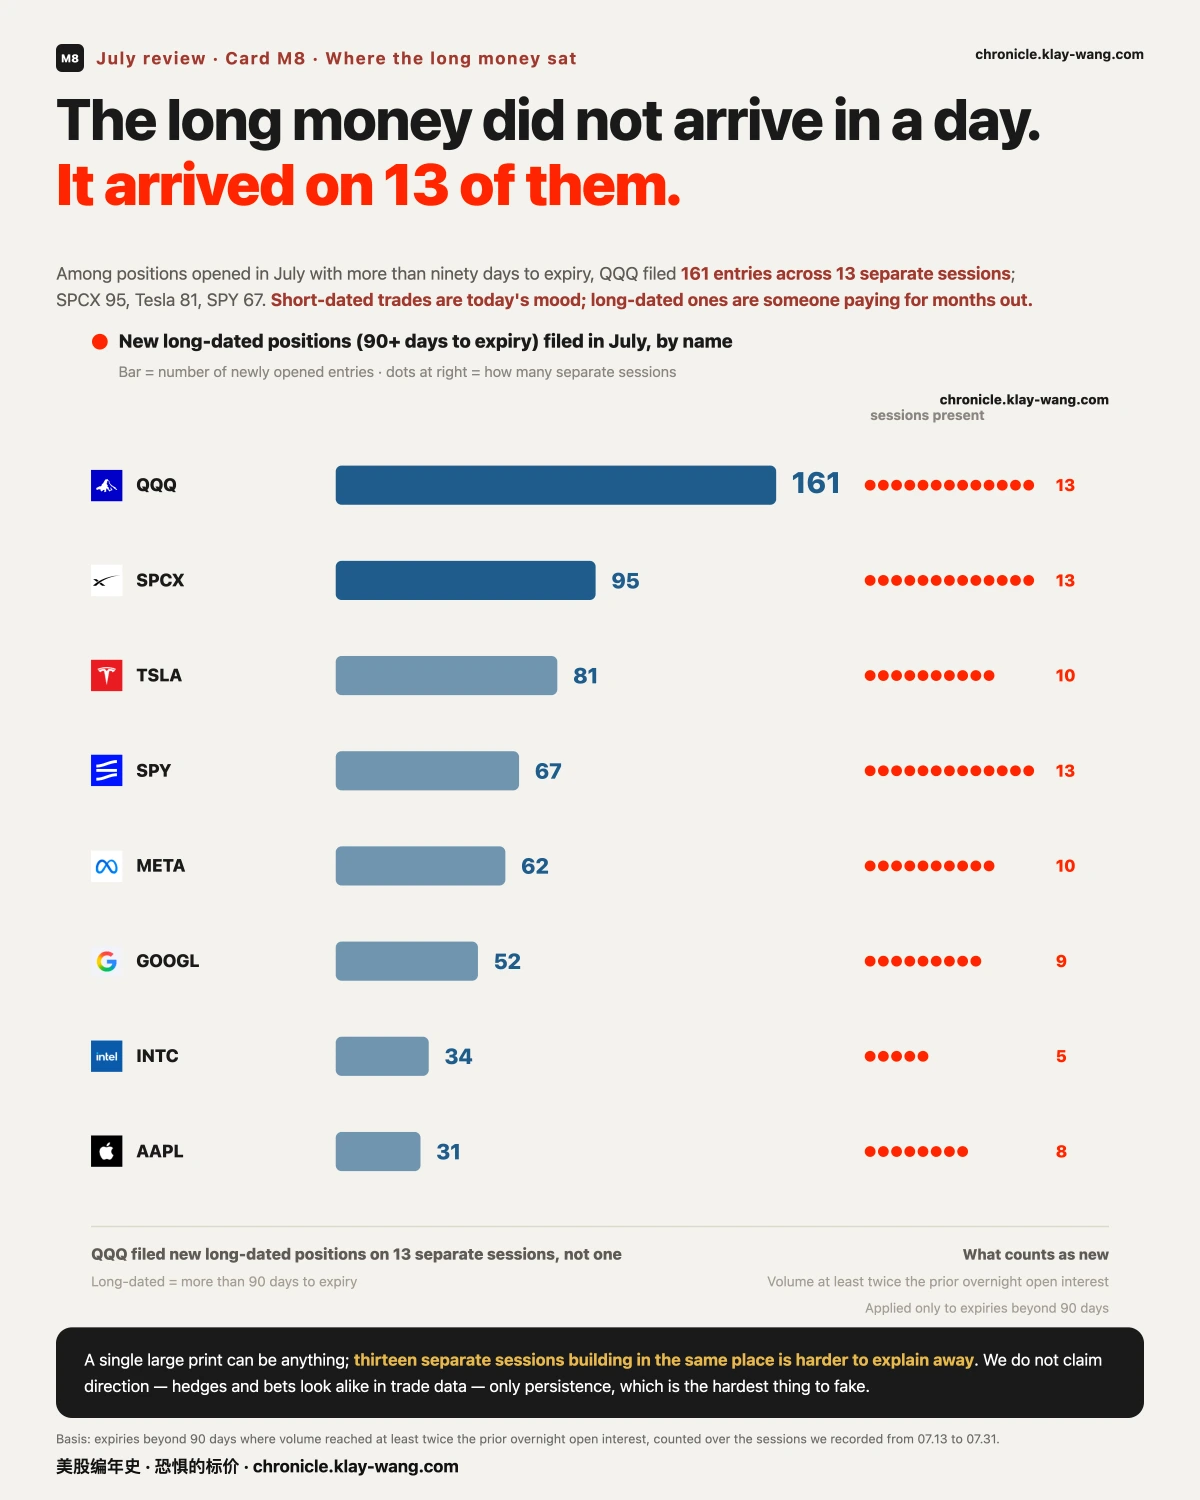
第三件:长天期的钱压根不在存储上。 到期在三个月以上的新建仓,前四名是纳指 ETF(161 条 / 13 个交易日)、SPCX、特斯拉、标普 ETF:存储一只都没进前四。短打热闹、长钱缺席,这两句要一起说才诚实。

八月的位置已经摆在那里了。 07.31 收盘时,美光的现价站在自家伽马翻转位 上方约 27 点,英特尔在自家翻转位 上方约 7 点,超微 上方约 45 点;而闪迪当天的翻转位算不出来(我们的两把尺子都给不出值,这在本账里是第一次,原样记档)。同一时点,标普与纳指的现价都贴在各自翻转位下方(标普差 0.68 点、纳指差 4.93 点)。

八月最挤的一个日子是 08.21:我们 07.31 一天就记到 562 条押在这个到期日上的异常成交,是次高(08.14 的 256 条)的两倍多。那天是月度期权到期日:七月的 07.17 就是这样一天,当天谷歌的现价、两道墙、翻转位、最大痛点全部挤进 1.4 点之内。

所以八月我们盯三件事,都不需要预测方向,到点自己会有答案:

存储是不是死猫跳,我们不猜。但下个月的每一天,这三个位置都会告诉我们一点新的东西,而它们现在就已经写在账上了。

十、这支温度计到底关你什么事(每期都会讲,这次讲透)

你大概率没买过一年期期权。所以先说结论:这个数字不是给买保险的人看的,是给卖保险的人开的价。

先把两个数分清楚。 大家熟悉的恐慌指数(VIX)量的是未来三十天:今晚会不会出事。它一天能跳 20%,一条新闻就够。我们这支温度计量的是未来一年:这一整年的不确定性,现在值多少钱。它一天动 2 个点就算大动作。

为什么长的那个更值钱? 因为短的那个是情绪,长的那个是成本

做市商必须报价:不管他看多看空,客户要买保护,他就得给一个数。他不猜方向,他只算一件事:我承担这个风险,得收多少钱才不亏。这个数是算出来的,不是感觉出来的。 所以它一天变三次是不可能的;它一旦真的动了,说明有人的成本模型改了。

它跟你的持仓有什么关系,三种情况:

一、你被一条新闻吓到、在想要不要跑的时候。 看短端和长端有没有分家。如果恐慌指数飙了、这个数没动:你慌在了专业资金前面,卖保险的人认为这是一次事故,不是路况变了。如果两个一起涨,那才是重定价。七月这两种都出现过:决议日两个一起冲到 88.4,第二天长端两天回吐 19.9,最后收在全月最低的 68.5。

二、你想给持仓买份保护的时候。 这个数直接告诉你现在买贵不贵。今天 68,意思是这份保险比过去三年 68% 的日子都贵。它不告诉你该不该买,它告诉你你付的是什么价。

三、你买过雪球、结构化票据、或者任何带保本触发字样的产品。 这条最直接:定价你那份合约的,就是这条曲线的长端。 你签的那张纸背后,发行方卖给你的正是一年期以上的波动率。这个数高,意味着同样的结构现在能给你更好的条款;这个数低,意味着条款会变差。你没看过它,但它一直在给你定价。

谁天天在用它: 做市商给长期期权报价用的就是这条曲线的长端;养老金和保险公司做长期对冲买的是一年以上的保护;发行结构化产品的机构,成本直接吃这个数。这些人加起来,是市场上最不需要靠猜方向吃饭的一批人。

所以这支温度计的用处,一句话:它不告诉你明天涨跌,它告诉你,那批必须给未来一年报价、并且要为报错付钱的人,今天报了多少。

十一、Citadel 在那场爆仓里是反派吗

七月最后一周,一支峰值约 450 亿美元的基金把全部公开持仓协议转给了 Citadel,同时缩到约 100 亿。它用了约 4 倍杠杆,收到三家主经纪商的追加保证金通知;转手前六天,创始人还在募资信里喊加码。(据 Bloomberg / CNBC / Semafor 交叉,细节最全的是 Semafor 版本。)

看到大机构围猎某个玩家,第一反应通常是华尔街巨鳄又在收割人。我们不替任何一方说话,但从这本账天天在看的东西出发,有三件事值得摆出来。

一、异常的回报加上公开的持仓,等于暴露的弱点。 一两年用几亿做到几十倍,选股准只是入场券,高杠杆是必然。而极高的收益不只是战绩,它同时是诱饵:当你赚得太快,所有顶级玩家都会开始反推你的仓位在哪。更何况持仓披露写得清清楚楚:哪怕滞后一个季度,方向也够了。在这个市场里,赚得漂亮和被看穿,是同一件事的两面。

二、定向爆破不是恶意,它是一类常规的收益来源。 发现一个杠杆过高、且持仓流动性很差的对手盘,然后把它推到追加保证金那条线:这在机构语言里叫提供流动性并收取风险溢价。听起来冷血,但机制上它和做市商在你恐慌时接你的货是同一件事:当你的流动性覆盖不了你的杠杆,你就成了别人的利润来源。 这不是道德问题,这是结构问题。

三、这类猎手的存在,某种程度上是在保护市场。 如果没有人去定点清除高杠杆玩家,泡沫只会被吹得更大,最后换来的是更大的系统性事故:2008 年就是没人及时清除的结果。这些机构的存在,逼着所有基金在加杠杆的时候真的去做压力测试。健康的市场需要多头,也需要空头。恐惧是维持市场理性的唯一工具:而给恐惧标价,恰恰是这本账每天在做的事。

从我们的数据视角,这件事解释了一个方法上的选择。 我们每天记的是留仓率,不是成交量。成交量只说明那一刻有人付了钱;只有隔夜持仓才说明他愿不愿意、以及扛不扛得住把这笔钱留在场上过夜。一支 4 倍杠杆的基金在崩之前,成交量上看不出任何异样:它出问题的地方从来不在买没买对,而在能不能撑到兑现。这也是我们这个月那句叠句的来处:幅度是市场给的,能不能拿住,是杠杆在事前就决定了的。

这一节引用的全部是公开报道与已披露持仓,我们没有任何一方的内部信息;判断的部分是机制解释,不是对任何机构动机的指控。

十二、华尔街不希望你知道的

华尔街真正不希望你知道的,不是哪只票要涨。是这件事:它不靠赢你赚钱,它靠你一直坐在牌桌上赚钱。

老派交易台训练新人,第一堂课往往不在办公室。做法是带他去一趟赌场,什么都不教,只让他玩,然后在旁边看他怎么玩。因为赌场是这个世界上把人性压缩得最狠的地方:它把你未来三十年在市场上会犯的错,用一个晚上演完给你看。

七月的赌桌长什么样。 标普 ETF 全月 +0.03%,而 17 只标的最高与最低差 71.2 个百分点。财报前市场自己用真金白银画的四道波动围栏,破了三道。07.31 那天,闪迪开盘时还涨 8.10%,从开盘算跌 12.20%;美光跳空 +5.18%,从开盘算跌 10.54%。为未来一年买保险的价钱在联储决议那天冲到全月最高 88.4,两个交易日回吐 19.9,最后收在全月最低的 68.5

这就是高波动的真实形状:不是一路往下,是同一天里,看多和看空的理由同时成立。 涨的时候你觉得自己看懂了,跌的时候你觉得自己被骗了,而这两件事发生在同一根 K 线里。

它来之前,账上有四件可测的事。 其一,长端保险价跟着短端一起涨:短端单独飙是一次事故,两端一起动才是重定价,七月两种都出现过。其二,市场自己画的波动围栏开始被系统性击穿:四道破三道,说明连愿意为幅度下注的人,估的都不够宽。其三,跳空和盘中开始反号:高开被卖、低开被买,说明隔夜那批人和日内那批人看的根本不是同一件事。其四,同一天里有票收在当日区间的 88% 位置,有票收在最低的 1%。

这四件事一件都不预测方向。它们只说明一件事:这张桌子的赔率变了。

赌场为什么能赚钱。 不是因为它让你输。任何一把你都可能赢,赌场的数学优势通常只有几个百分点。它真正卖的不是那几个百分点,是你会回来。它有两样你没有的东西:无限的时间,和无限的次数。所以它从来不需要赢你,它只需要你不离开。

台面上的钱,不是你的钱。 假设某个晚上你顺得离谱,台面上堆到七八百万。只要你还坐在那儿,那就不是你的钱,那是赌场先借给你、好让你继续玩下去的筹码。

而人性是什么?人性是台面上的已经是我的了。

于是最后一把判断错了,全部回吐。你带进去的本金,只有一两万。

第二天别人听说这事,会说他只输了一两万,还好。但你自己知道,你输的是七八百万。

这个落差才是真正的伤害。 账户上少了一两万,心里少了七八百万。从那一刻起,你之后下的每一笔单,都是那个输了七八百万的人在下的。
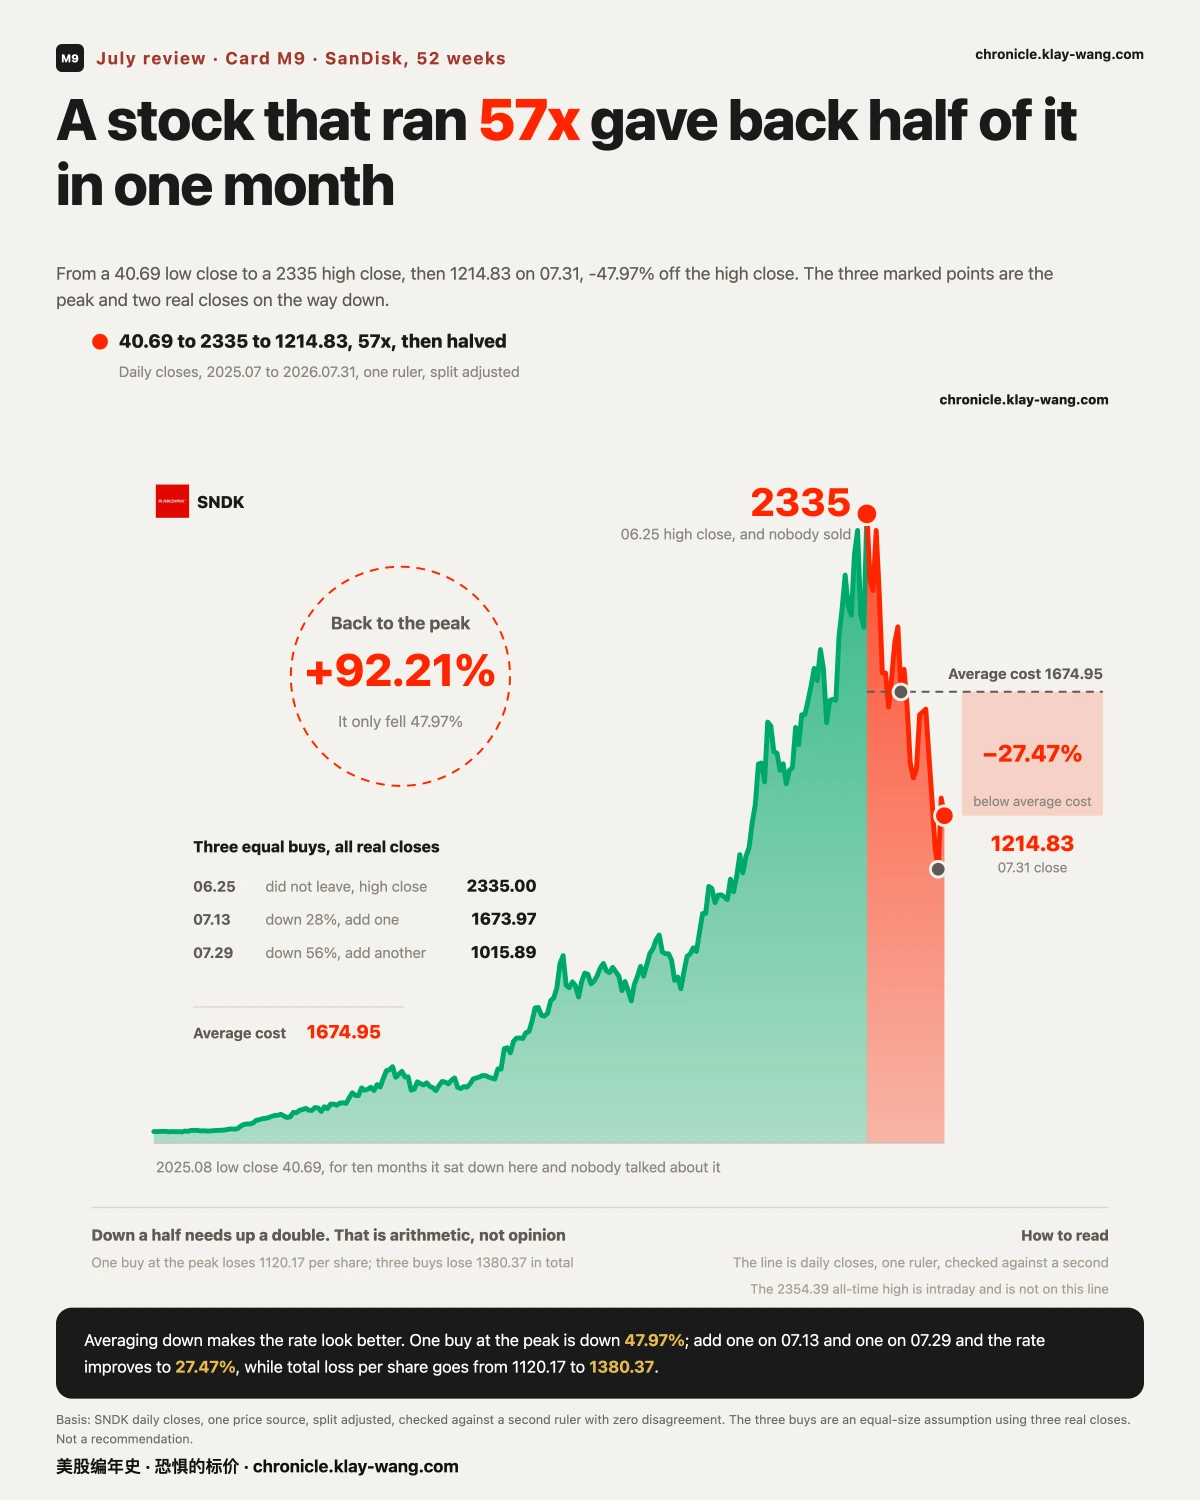
卡9_闪迪过山车_EN
接下来的动作几乎是固定的:去 ATM 取钱。 取第二次的时候,你已经不在玩原来那个游戏了,你在跟一个数字较劲。你不研究规则,也不研究概率,你只想把那个数字追回来。而高波动的市场刚好会不停给你机会,遍地都是入口,每一个都长得像最后一次翻盘。

这里有一个不需要任何数据的自查,也是这一整节唯一的实操:下这一笔之前问自己,我下它是因为我看到了什么,还是因为我上一笔亏了。 第二种答案出现的那一刻,你已经站在 ATM 前面了。

为什么高波动几乎注定不属于普通人。 机构在这种月份里能活下来,靠的不是看得更准,是三件普通人做不到的事:能对冲,能分批,能不玩。前两件要钱,第三件要心。

这本账上就有现成的例子。07.22 有人在美光 800 线砸下一亿美元的大单,07.31 到期,收盘 823.03,保本线 996。这一笔亏了。 那不是散户,那是能一次下一亿美元的人。高波动不看你有多少钱。

同一本账上还有另一笔:07.20 清晨,有人用 12000 美元买了三千张四美分的深度崩盘保险,一笔打完,全天再无加仓,整个七月一次都没用上。这笔也没赢。但它和上面那笔的区别不在看得准不准,在于下的注是不是自己输得起的那个数

最后说那件最没人愿意听的。 很多人看不上一年只涨十几个点的东西,嫌慢,觉得那点幅度不值得占仓位。但七月这张表本身就是回答:跨度 71.2 个百分点,指数走了 0.03%。 那些让人夜里睡不着的幅度,最后在指数上互相抵消掉了。

慢的那个,你晚上不会去想它。而正因为你不想它,你就不会在凌晨三点改主意;不改主意,时间才有机会替你干活。资产是这么长起来的,不是靠某一把。

幅度是市场给的,能不能拿满整段,是心境给的。

回到开头那句。华尔街不需要你输,它需要你一直在场:每一次换手、每一次想追回来、每一次凌晨改主意,都是在给这台机器交一次过路费。你看得见筹码,才不至于只看得见运气。

这一节讲的是行为与机制,不是任何一类资产的推荐,也不构成投资建议。我们不知道你该买什么,我们只知道七月这张表长什么样。

十三、八月坐标(只给日历,不给方向)

08.03:07.31 标普那两组蝶式几何的持仓,结算后涨不涨。
08.07:非农(微软那条看跌带里,08.07 那一档同日到期)。
08.12:通胀数据:也是上面债市那段的第一个检验点。

08.21
:月度期权到期日,墙位会整个重排。

09.04
:标普那笔两侧单的到期日,也是九月初的非农发布日。

有人已经为这些日子付了钱。我们不猜他们对不对,到点回来对账,落哪边都照记。

十四、收尾

七月的最后一天,指数收在它一个月前出发的地方。同一个月里,有一只票涨了四分之一,有一只票少了将近一半;有人为一年后的保险付出了三年里最贵的价钱,六天后又收在了全月最便宜处;而在另一张桌子上,最长期的那笔钱在月末悄悄要了更高的价。

指数只告诉你平均发生了什么,它从不告诉你发生在谁身上。 我们这个月做的全部事情,就是把发生在谁身上一天一天记下来:包括记错的那些。

八月接着记。


🌍 English edition
SPY finished July at +0.03%, a month, and it went nowhere. Inside it, Microsoft +24.58% and SanDisk −46.57%: 71.2 points between best and worst
Our filed calls settled: 0 for 2 on rank and size, 3 for 0 on reading structure; two more we could not answer, filed as unmeasurable
Three of four earnings fences broke out, and in the month's final two sessions, the 30-year minus 10-year Treasury spread widened to 55bp, July's high

1 · The last day was the month in miniature

SPY closed 07.31 at 747.03, +0.03% for the month, back where it started. Intraday it ran to within 0.31 points of its own gamma flip in the first five minutes, was refused, lost 8.6 points over forty minutes through three levels, and took all of it back by the close. The macro release that morning moved it 0.6 points.

The closing price said nothing; everything in between was the content. An index tells you what happened on average. It never tells you who it happened to.

2 · The scoreboard, mistakes first

Wrong, both the same way: we said Alphabet would move more than Tesla on earnings night, Tesla did; we said neither would leave its volatility fence, both fell through the floor. Both were guesses about size and rank.

Right, all the same way: Nvidia's deep-in-the-money print was a roll (both legs moved overnight); five legs across three names were one program trade; earnings-week implied volatility would crush at the open (it fell 55 to 60 points). All three read structure the money left behind.

Two have no answer. Intel's four-leg stack and Micron's call ladder expired on 07.31, and same-day expiries offer exactly one window to check open interest, our collection missed it. "Unmeasurable", not "denied".

The pattern is uncomfortably clean: 0 for 2 guessing where price goes, 3 for 0 reading what the money is doing. We do not guess the cards; we watch the chips.

A record is worth something only because it is logged before the fact and never edited after. Allow yourself to go back and tidy it, and the whole book is worth nothing. Every miss on the scoreboard is what makes the hits worth reading.

3 · A flat index and the 71 points underneath

Seven of seventeen up, ten down. Above: Microsoft +24.58%, Amazon +13.95%, Apple +6.76%. Below: SanDisk −46.57%, SPCX −36.57%, Intel −35.40%, Micron −28.70%, Tesla −26.01%. In the middle: SPY +0.03%, QQQ −6.57%, Nvidia +0.33%.

This is not "the index was fine and stocks were not", the two extremes cancelled each other out. One caveat on storage: SanDisk went from 40 to 2354 over 52 weeks, 58-fold. July's −46.57% is a descent from altitude, not a mispricing.

4 · Three lenses

Price, a month about levels. On 07.17 expiry, Alphabet's spot, both walls, its flip and max pain sat inside 1.4 points. 07.20 reset everything; 07.29 brought the Fed; earnings week redrew the gamma map overnight (QQQ's flip fell 33.5 points, Micron's 96.5). By 07.31 Apple closed under its own put wall and Amazon sixteen points through its call wall. Not because walls are magic, because real money sits at those strikes, and every expiry forces a full re-read.

Money, what we logged, and what came after. A $12,000 print for 3,000 four-cent crash puts on 07.20; a $100M block at Micron's 800 line on 07.22; Nvidia's roll on 07.23, confirmed the next day; on 07.30, Intel's four legs and SPY's both-sides prints on 09.04, which settled into July's cleanest contrast: same day, same expiry, the puts kept 60% of their volume overnight and the calls kept 8.7%. That expiry sits on August payrolls. Being checkable is the whole moat.

Fear, 73.5, then 88.4, then 68.5. Opened July at 73.5, 70.6 on 07.10, 82.9 at expiry, 88.4 on Fed day, gave back 19.9 over the next two sessions, closed at 68.5, its July low. The spike and the give-back both landed on event day and the day after: fear priced against specific dates, not against the year.

5 · The fences: three out, one in, and a reversal

Anchored to the 07.27 close, printed in advance, unchanged since. At settlement: Microsoft +19.43% vs ±6.17%, out. Amazon +17.37% vs ±5.89%, out. Apple −8.31% vs ±3.35%, out. Meta −6.26% vs ±6.98%, inside.

Three left the width the market quoted for itself; this round was underpriced for size. But the one to remember is Meta: on 07.30 we printed it as outside at −9.23%, and by settlement it was back inside. That mid-course reading was not wrong, it simply was not a conclusion. Same lesson as our six-point sampling on Fed day, where one session gave three contradictory but equally real answers depending on the minute. We anchor to the close not because it is more accurate, but because it is the only point we do not have to choose.

6 · In the month's last two sessions, the bond market moved

Deleveraging solves a funding problem; how far a rebound travels is decided at a different table. And in July's final two sessions, there was a checkable change at that table: the 30-year minus 10-year Treasury spread widened from 47bp at its monthly low to 55bp, three basis points on Fed day, three more the day after, easing to 53bp on the final session while both legs stepped higher again (10-year 4.74%, 30-year 5.28%, both July highs).

Both legs fell in price and the long leg fell harder: from 07.29 to 07.31 the 10-year went 4.62% → 4.74% and the 30-year 5.14% → 5.28%, the long leg falling harder. That shape is not trading "one more hike"; it reads more like repricing long-run inflation, the policy path, and fiscal credibility.

There is a phrase for this: bond vigilantes. The Treasury market has no retail; it is institutional money, and when that money dislikes a policy it does not issue statements, it votes with price. In a real sense, the bond market is doing part of the Fed's tightening for it, and it never asks equities for permission.

This is July's question mark for August, not an answer, and it is checkable: the 30-year closed above 5.1% for July's final three sessions and at 5.28% on the last; if that level keeps rising the headwind stays on the books, back below 5.0% and the paragraph is closed. August's inflation print on 08.12 and the month's long-bond auctions are the next two dated checks.

July was a hard month, and its last week finally delivered a real rebound. That does not contradict the paragraph above, they are simply two different tables.

7 · What we said, and what happened

Not to take credit, so you can check. A ledger is only worth something if it invites you to look back.

On 07.27 we wrote that the market was pricing Nvidia's credit story, not storage's supply story. That day it was one observation. By month-end: Nvidia +0.33%, storage −28.70% and −46.57%. Two stories, two entirely different prices, and the split ran the whole month.

On 07.25 we wrote that storage had fallen a third while the ticket to ride had gotten more expensive. The point was never direction; it was a measurable fact, the stock falling while its insurance repriced higher. By month-end storage had fallen further, and its long-dated insurance is still the dearest in this universe (SanDisk's one-year reading at 106.51, more than five times SPY's). Cheap it did not get.

On 07.23 we wrote that storage options had acted out Alphabet's script before the CFO read the numbers. Capital expenditure did become one of the month's main lines.

And what did not land: the four-cent crash puts from 07.20 were never needed. We only ever wrote that someone paid that price, never that they would win, which is why nothing needs walking back now. The $100M block at Micron's 800 line settled on 07.31 at 823.03, far below its 996 breakeven. That one lost, and we file it.

8 · Three open questions (evidence → reasoning → what would overturn it)

The index: calm, or a tug of war? Evidence: SPY +0.03% while its components spanned 71.2 points, and the price of a year of insurance ran 73.5 → 88.4 → 68.5. Reasoning: calm would leave both the index and its components still; a tug of war leaves violent component moves that cancel at the index, July was the second. "The market was calm in July" holds at the index level and fails underneath it. Overturned if: August narrows the component spread inside 30 points while the index still goes nowhere. That would be actual calm.

Inside tech: rotation, or dispersion? First, what we cannot say: "rotation" claims money moved from A to B, and that requires flow data we do not have, so we never use the word. What we can measure is dispersion: on the same session, Microsoft opened flat, earned all 3.27% intraday and closed at 88% of its range, while AMD and Intel closed in the bottom 1% of theirs. Monthly: Microsoft +24.58%, Intel −35.40%, both filed under "tech". Reasoning: what is confirmed is that assets under one label have stopped moving together; what is not confirmed is whether money crossed between them. Overturned if: daily correlations recover in August and these names start moving as a bloc again.

Storage: dead-cat bounce, or turn? We do not answer direction, but the question breaks into checkable coordinates. Evidence: SanDisk ran 40 → 2354 over 52 weeks (58-fold), fell 46.57% in July, and sits 48.40% below its all-time high; Micron −28.70%. On 07.31 both showed the same intraday shape, gap up, sold all day: SanDisk was +8.10% at the open and fell 12.20% from there; Micron gapped +5.18% and fell 10.54%. Reasoning: the gap was given overnight and the session sold it, those are not the same participants, and the full-day number erases the distinction. Meanwhile someone paid $5.17M for Micron's 1000-line calls inside that red candle (vol/OI 3.66, newly opened). Overturned by, in either direction: first, whether gap and session turn the same sign again for several sessions; second, whether long-dated insurance comes down from SanDisk's 106.51. We record both daily, and we will come back.

9 · What Wall Street would rather you did not know

What Wall Street would rather you did not know is not which name is going up. It is this: it does not make money by beating you. It makes money by keeping you at the table.

The oldest first lesson on a trading desk was not taught at a desk. You took the new hire to a casino, taught them nothing, and watched them play, because a casino compresses thirty years of market mistakes into a single evening.

What July's table looked like. SPY finished the month at +0.03% while the spread between its best and worst name was 71.2 points. Three of the four earnings fences the market priced in advance were broken. On 07.31 SanDisk was up 8.10% at the open and fell 12.20% from there; Micron gapped +5.18% and fell 10.54% from its open. The price of a year of insurance hit 88.4 on decision day, gave back 19.9 in two sessions, and closed the month at its cheapest. High volatility is not a straight line down. It is a day on which the bull case and the bear case are both true.

Why the house wins. Not because you lose. On any single hand you might win, and the house edge is usually a few percent. What it actually sells is your return trip. It has two things you do not: unlimited time and unlimited hands. It never needs to beat you; it only needs you not to leave.

The chips in front of you are not your money. Say a good night runs your stack up to seven million. While you are still sitting there, that is not your money; it is what the house lent you so you would keep playing. Human nature says: what is on the table is already mine. So the last hand goes wrong and all of it goes back. You walked in with twenty thousand. The next day people say he only lost twenty thousand. You know you lost seven million. That gap is the real damage: the account is down twenty thousand, the judgment is down seven million, and every trade you place afterwards is placed by the person who lost seven million.

Then comes the ATM. By the second withdrawal you are not playing the game any more, you are arguing with a number. The one self-check in this section needs no data at all: am I placing this because of something I saw, or because the last one lost? The moment the answer is the second one, you are already at the ATM.

Why high volatility rarely belongs to retail. Institutions survive months like this not by seeing more clearly but by doing three things most people cannot: hedge, scale in, and sit out. The first two cost money; the third costs composure. Our own ledger has the proof: the $100M block at Micron's 800 line on 07.22 expired 07.31 at 823.03 against a 996 breakeven. That one lost, and it was not retail. Volatility does not care how much money you have. On the same ledger, the $12000 paid on 07.20 for three thousand four-cent crash puts never paid off either, and the difference between the two is not accuracy. It is whether the stake was a number you could afford to lose.

And the part nobody wants to hear. People dismiss an asset that returns low double digits a year as too slow. July is the answer: 71.2 points of spread, and the index moved 0.03%. The moves that keep you awake cancelled each other out. The slow one you do not think about at night, and because you do not think about it you do not change your mind at 3am, and time gets a chance to do the work.

The size of the move is given by the market. Whether you hold the whole of it is given by your composure.

Back to the top. Wall Street does not need you to lose, it needs you present. Every turnover, every attempt to win it back, every 3am change of mind pays a toll to that machine. You are less at the mercy of luck once you can see the chips.

⚠️ This section is about behaviour and mechanism. It is not a recommendation of any asset class and it is not investment advice.

10 · August markers (dates only, no direction)

08.03, whether the open interest behind 07.31's two butterfly structures appears. 08.07, payrolls, and one strike of Microsoft's put band. 08.12, inflation, the first check on the bond paragraph above. 08.21, monthly expiry; walls get rebuilt. 09.04, SPY's both-sides expiry, and September payrolls.

Someone has already paid for these dates. We come back and publish, either way.

11 · Closing

July ended where it began. Inside that same month, one name gained a quarter of its value and another lost nearly half; the price of a year of insurance ran to its dearest in three years and, six days later, closed the month at its cheapest; and at another table, the longest-dated money quietly asked for more.

An index tells you what happened on average. It never tells you who it happened to. Everything we did this month was write down who, including the times we got it wrong.

August, same.


美股编年史 Market Chronicle · 本文为历史归档,数字与判断均为当日口径,事后不回改。
本站不提供投资建议,不预测方向,不做择时。