Is Trump Selling Stocks Again? The Week of August 17 to 21
[Disclosure] Is Trump Selling Stocks Again? The Ledger Says No
Answer the headline first.
A personal financial disclosure filed on August 22 shows more than a thousand securities transactions completed during June. Purchases exceeded 49 million dollars. Sales came to at least 28.5 million. Put the two together and June was a month of net buying, not selling.
So why does it read as selling. Because the trades that get written up are the sales. Meta and Motorola Solutions sold on June 18, a Vanguard dividend growth fund sold on June 22. The Berkshire B shares, Cintas, Visa and Mastercard bought the same day, and the FIS and Home Depot bought on the 22nd, do not make the headline.
That is not anyone's failure. It is the default shape of list journalism. Out of a thousand transactions, the ones that get written are the ones that make a story. The ledger and the list leave opposite impressions.
The most important thing about this filing is that it is not about this week
The trades are from June. The filing landed on August 22, a lag of close to eleven weeks.
The amounts are ranges, not numbers. The total is given as 78.1 million to 263.1 million dollars, a spread of 3.37 times. Individual lines run the same way: one to five million is a five times range, 1,001 to 15,000 dollars is a fifteen times range.
One line makes the problem visible on its own. Palantir: bought 1,001 to 15,000 dollars on June 3, sold 15,001 to 50,000 on June 16, then sold 500,000 to one million on June 18. The sales are an order of magnitude larger than the purchase, and the ranges are wide enough that you cannot reconstruct what happened in between. A document that will only give you ranges is telling you not to infer from it.
The Meta trade has the same disease as this week's bond section
Meta is one of the seventeen names we track, so this one we can check.
Meta closed at 577.22 on June 18, the day of the sale.
- July 15 close 681.31, which is 18.03 percent above the sale
- July 30 close 539.03, a fall of 20.88 percent from that high
- August 21 close 549.90, 4.73 percent below the sale
The filing appeared on August 22. So on the day you could read it, the trade looked correct by 4.73 percent. It was wrong by 18.03 percent for seventeen sessions in between.
Which is the same point as the bond section further down, on a different document. The net records the endpoint. The path is a separate fact. Bonds went around and came back. This went wrong for a month and then came right. In both cases the road had already been travelled by the time anyone could see it.
So the use of a disclosure is not to copy it. It is to have something to check yourself against. It tells you what one person did on one day. It does not tell you why, and it does not tell you whether it still holds. The value is in placing it beside something you can measure: 577.22 is one coordinate, this week's 549.90 is another, and the 18.03 percent round trip between them is what actually happened over those two months.
How we would know we are wrong: if the next filing arrives with less than two weeks between the trades and the disclosure, the criticism about lag no longer applies and we withdraw it.
That was a document about June. Now to this week. The same kind of question does not need a two month wait, because the prices are available the same day.
What This Week Covers
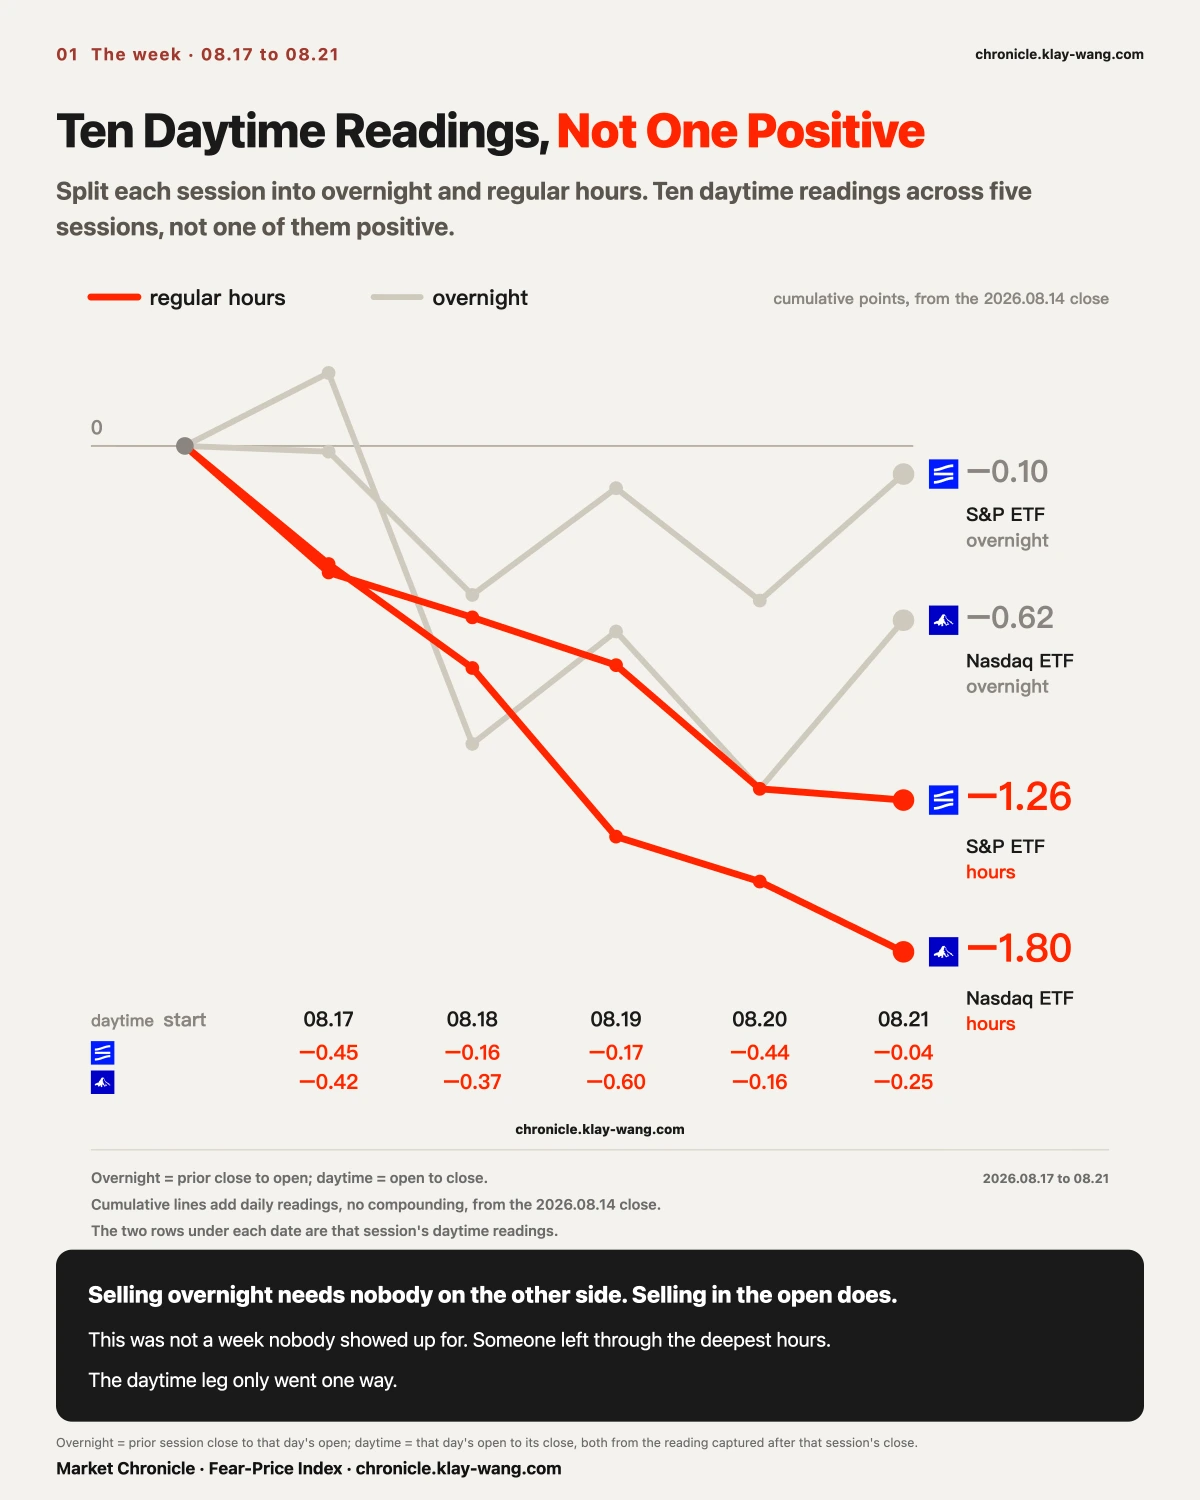
Split every session into two legs. The overnight leg runs from the prior close to today's open. The daytime leg runs from the open to the close.
Across five sessions the S&P ETF posted daytime legs of minus 0.45, minus 0.16, minus 0.17, minus 0.44 and minus 0.04. The Nasdaq ETF posted minus 0.42, minus 0.37, minus 0.60, minus 0.16 and minus 0.25.
Ten readings. Not one of them positive.
The S&P ETF lost 1.36 across both legs this week and 1.26 of that came during hours, which is 93 percent. For the Nasdaq ETF the total was 2.42 with 1.80 during hours, or 74 percent.
The overnight leg was not always green. Three of five overnights were negative for the S&P ETF. But an overnight decline was usually followed by more decline during the day, and no daytime session gave any of it back.
[The Board] Fifteen of Seventeen Closed Lower, and the Widest Swinger Ended Where It Started
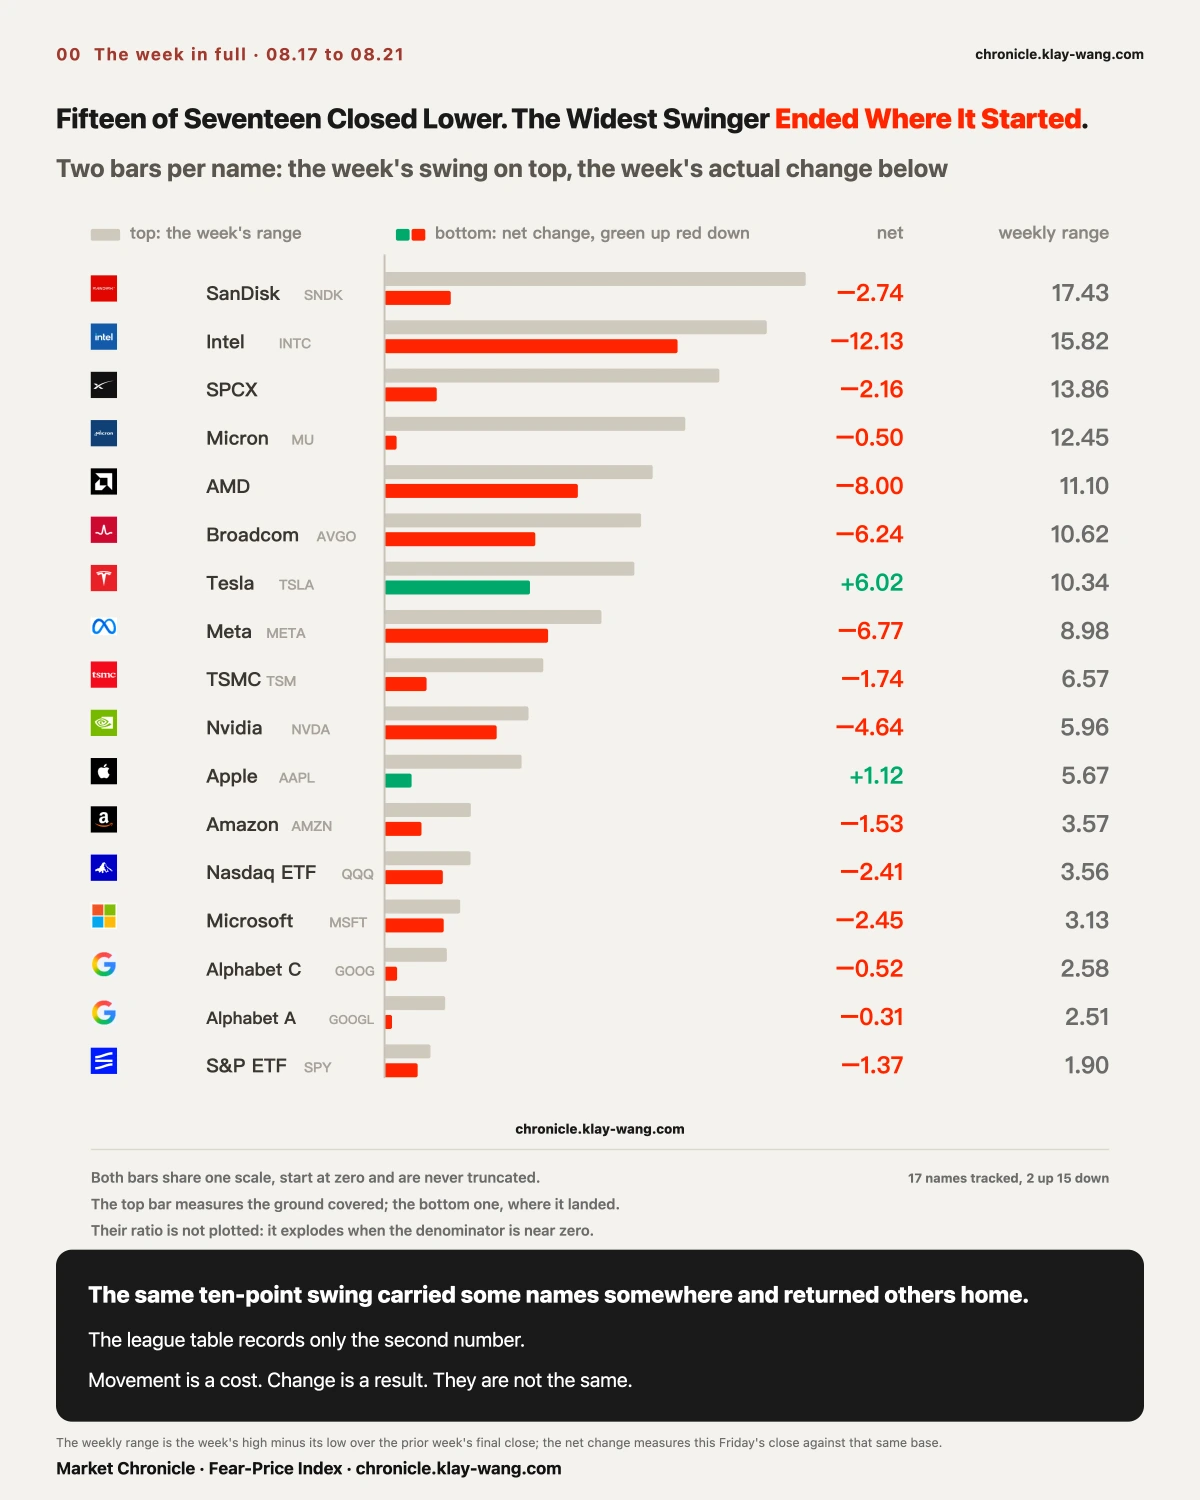
Seventeen names on the board. Fifteen closed lower. Only Tesla and Apple finished green.
Put each name's weekly swing next to its net weekly change and the gap is absurd. SanDisk swung 17.43 percent and finished the week down 2.74. Micron swung 12.45 percent and finished down 0.50, which makes the swing 24.8 times the net move. SpaceX swung 13.86 and finished down 2.16.
Intel is the counterexample that makes the point. It swung 15.82 percent and finished down 12.13. That one actually went somewhere.
Same twelve points of movement, and some names walked away while others came back to where they started. A leaderboard only records the second number.
[Distribution] Reddit Was Sold Down One Session at a Time
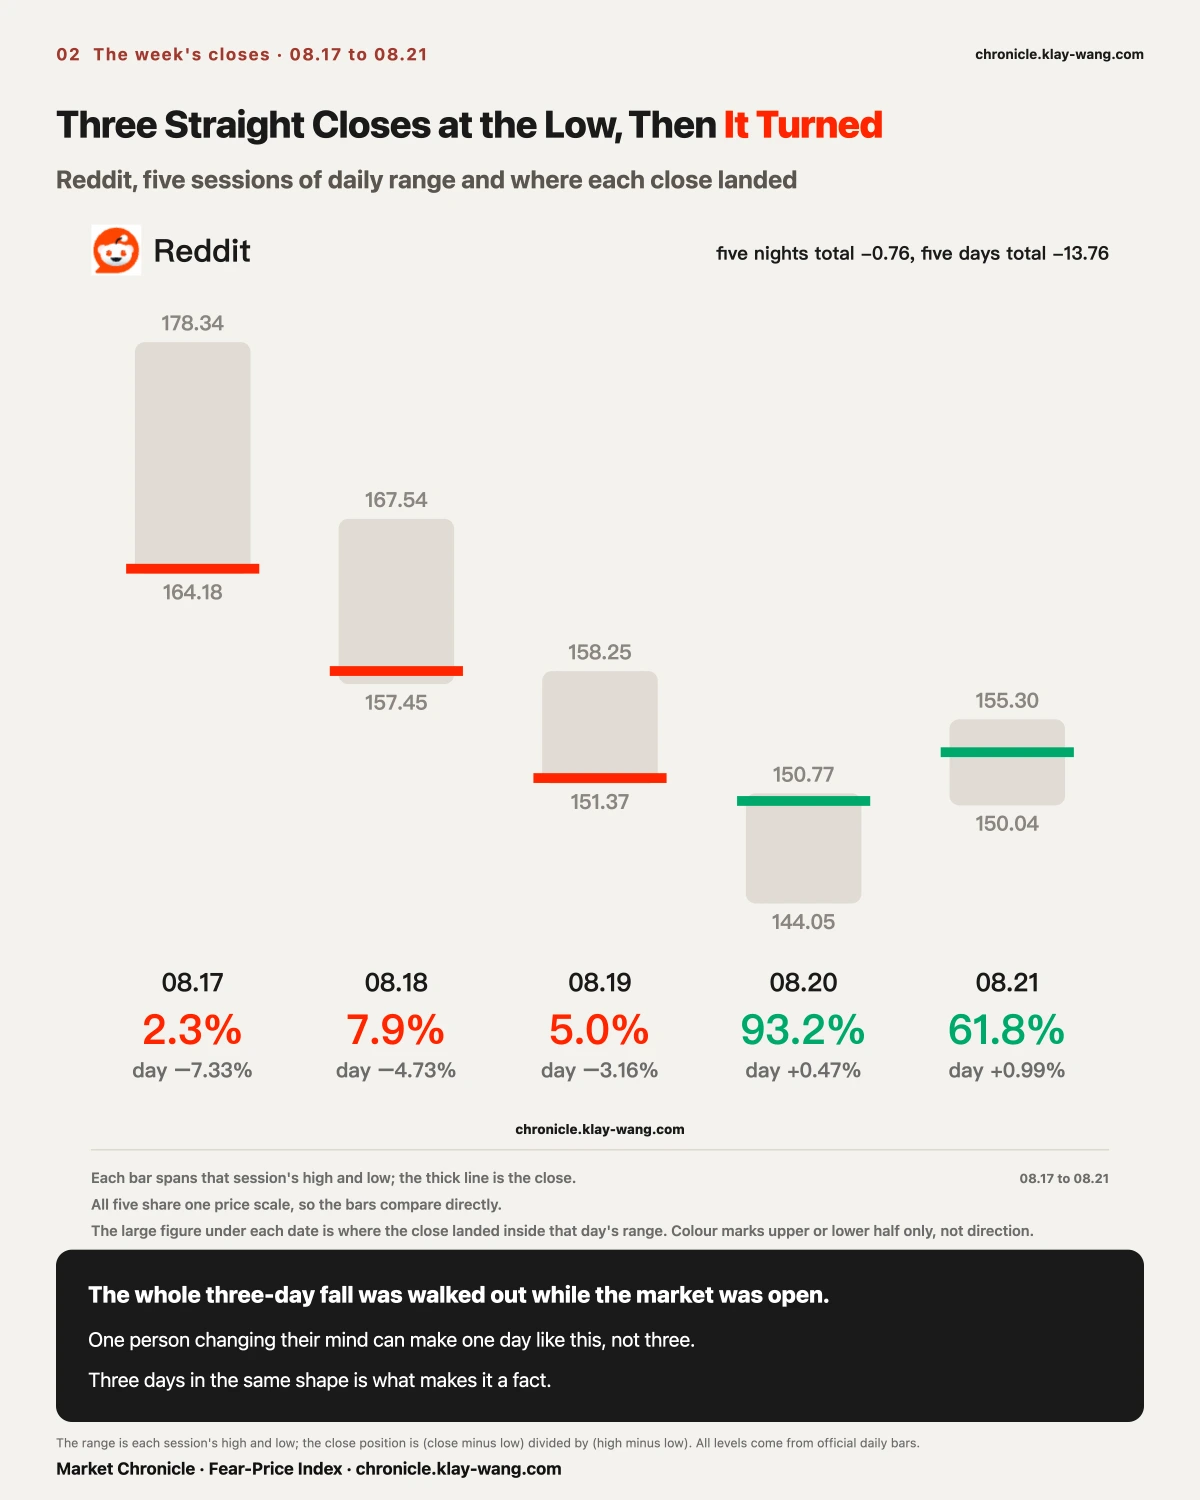
Reddit was the worst name of the week at minus 13.92 percent. Walking its five sessions gives you a picture of what deliberate selling looks like.
August 17. Prior close 178.09, opened 177.51, essentially flat. It ticked up to 178.34 and then went down all day to a low of 164.18, closing at 164.50. The day's range was 7.95 percent of the prior close and the daytime leg was minus 7.33. The close landed at 2.3 percent of the day's range, thirty two cents off the low.
August 18. Opened 166.10, high 167.54, low 157.45, close 158.25. Daytime leg minus 4.73. Close at 7.9 percent of range.
August 19. Opened 156.66, high 158.25, low 151.37, close 151.71. Daytime leg minus 3.16. Close at 5.0 percent of range.
Three sessions. Flat open, grind lower, close a hair off the low. The three overnight legs together moved minus 0.36.
Here is why this differs from Robinhood on August 20, and the difference is the whole point.
Robinhood also closed at 18.2 percent of its range that day. We read it as distribution and the next session answered with plus 13.70 percent. One low close tells you the bid could not hold that day. It tells you nothing about tomorrow.
Reddit closed at 2.3, then 7.9, then 5.0, three sessions running, every point of it during hours. A trader changing his mind can produce one session shaped like that. He cannot produce three. Three consecutive closes at the same place in the same window is someone working an order until it is done.
Was it done? August 20 closed at 93.2 percent of range and August 21 at 61.8 percent, with daytime legs of plus 0.47 and plus 0.99. The slide stopped on the fourth day.
[Contrast] The Same Method on Two Other Names Gives a Different Answer
ARM fell 12.93 percent on the week with 11.42 of it during hours, also above eighty percent. But its closing positions ran 0.9, 52.5, 29.6, 94.3 and 6.1 percent. No sequence.
Intel fell 12.13 with 9.91 during hours, and its closes ran 40.5, 35.3, 22.0, 80.6 and 10.6. Also scattered.
Both fell during the day, but Reddit sold on a rhythm and finished, while these two simply had nobody stepping in. On a leaderboard the three look identical. Three green bars.
[Fences] Five Sessions, and the Money Sat Below All Week
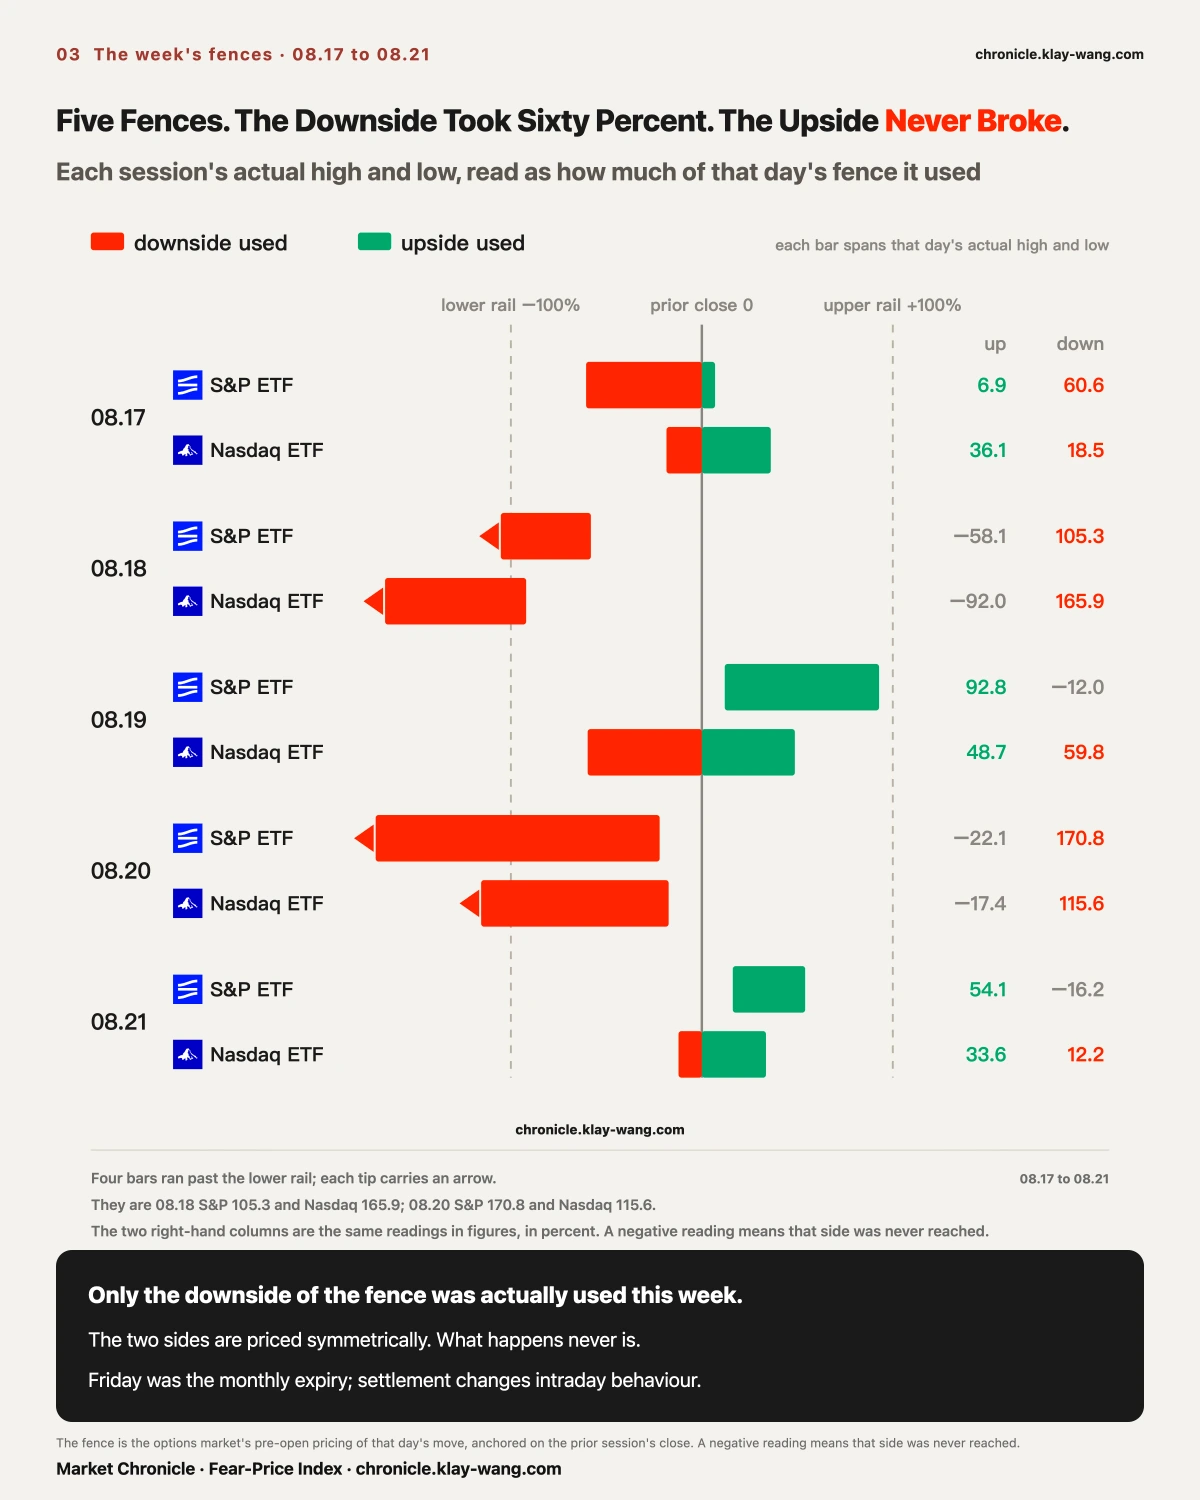
A fence is what the options market prices each morning as the day's likely range. Convert the actual high and low into how much of that range got used and you can see which side the money sat on.
Over five sessions the S&P ETF used an average of 14.7 percent of its upside half against 61.7 percent of its downside half. For the Nasdaq ETF the figures are 1.8 and 74.4.
The lower bound was breached four times: on August 18 the S&P ETF used 105.3 percent and the Nasdaq ETF 165.9, and on August 20 the S&P ETF used 170.8 and the Nasdaq ETF 115.6. Two of those went past one and a half times. The upper bound was never breached once.
Friday was the exception, with both names leaning up. That was monthly expiration and settlement changes intraday behaviour, so it gets read on its own rather than netted against the other four days.
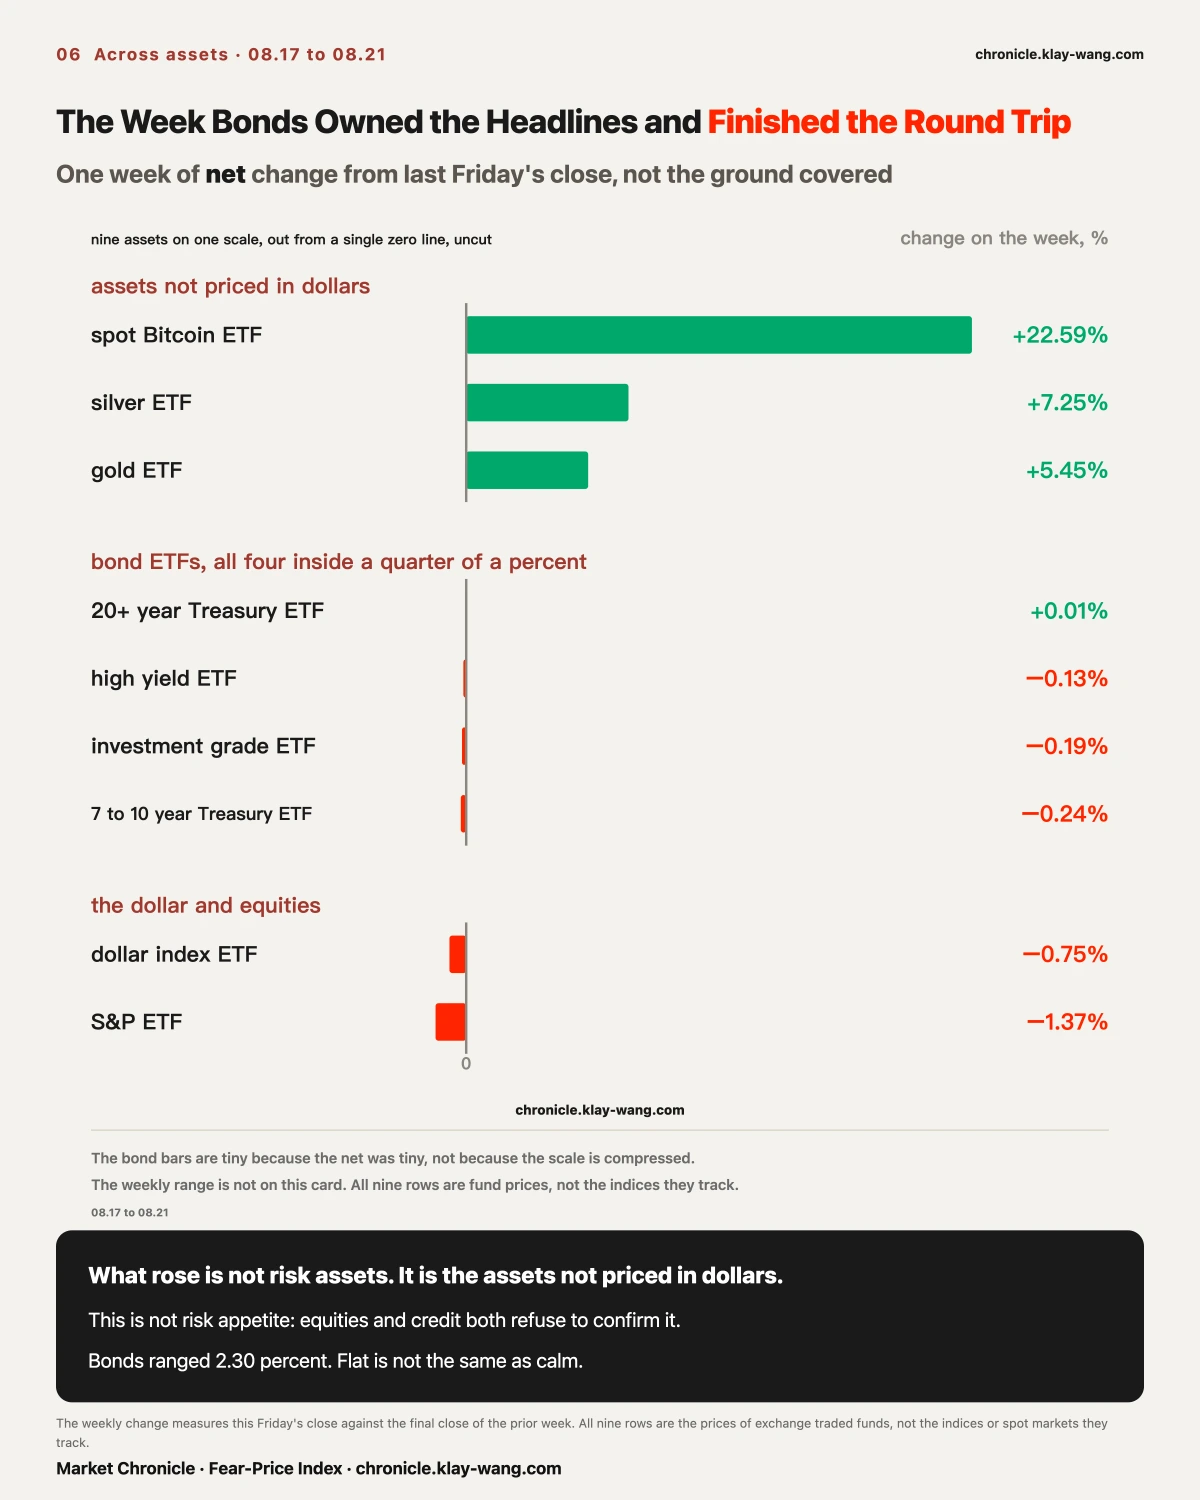
[Cross Asset] The Week Bonds Owned the Headlines and Finished the Round Trip
Macro coverage this week went almost entirely to Treasuries. The department at least doubled its long-bond buyback, the thirty year traded around a two decade high, and the press found a name for it.
Then look at the prices. Measured from last Friday's close, the twenty year plus Treasury ETF moved plus 0.01 percent on the week. Seven to ten year, minus 0.24. Investment grade credit, minus 0.19. High yield, minus 0.13.
The net is only half the week, and it is the boring half.
Measure the ground covered. The twenty year plus Treasury ETF printed a high of 83.06 on August 19 and a low of 81.17 on August 18. High to low is 1.89 dollars. Friday close to Friday close is one cent. The ground covered is 189 times the net. Against last Friday's close that range is 2.30 percent.
Rank that 2.30 against the last 39 weeks and it is the sixth widest week, the 85th percentile, where the median is 1.60. The five weeks above it netted minus 2.17, plus 2.49, minus 1.20, minus 2.81 and minus 2.12. Not one of them finished where it started.
Same fact from the other side. Of the last 39 weeks, seven netted inside plus or minus 0.30 percent. The second widest of those seven ranged 1.70 percent. This one ranged 2.30. Among the flat weeks, this was the most violent one.
So the accurate sentence is not that bonds did not move. Bonds went all the way around and came back. A round trip and a standstill look identical on a weekly chart and are nothing alike to the people inside them. Which is the same point we made about Micron two sections ago. This time we nearly made the mistake ourselves.
The people warning about the bond market were not refuted this week
Druckenmiller has compared the fiscal path of the last decade to watching a horror film. Dalio compares debt service to plaque building in an artery. Griffin says an unrepaired fiscal house eventually attracts someone who comes to collect. Those are claims about deficits, interest expense, term premium and who buys the next long bond. They are claims about the water level, not about these five days.
We measured a five day net and a five day range. Both things can hold at once, and this week they did: the long-run worry was not contradicted by this week's price, and this week's price did not cash that worry in either.
If this week added one piece of evidence, it is this. The thirty year gave back the entire announcement move inside a single day, which says this market has a short memory for policy news. A short memory is not the same as an absence of risk. It means the risk will not seep in gradually. It will arrive as one repricing. A week that ranges in the 85th percentile and nets zero is what that kind of market looks like, not what a calm one looks like.
How we would know we read it wrong: if the next macro event capable of moving the long end produces a direction that survives three consecutive sessions without being erased, the claim that announcements cannot buy a whole week has to be withdrawn. The next one is PCE on August 26. We will come back to it.
The movement was somewhere else. The dollar index ETF fell 0.75 percent. Gold rose 5.45. Silver rose 7.25. The spot bitcoin ETF rose 22.59.
There is an easy thing to say here and it is wrong: risk appetite came back.
It did not. If risk appetite had come back, equities and credit would not have fallen. The S&P ETF lost 1.37 percent this week, investment grade lost 0.19 and high yield lost 0.13. All three went down.
What rose was not risk. What rose was everything that is not denominated in dollars. Gold, silver and bitcoin do not share a risk profile. They share the property of not being anyone's dollar liability. The dollar fell in the same week they rose.
That also gives the crypto names a second reading. MicroStrategy up 28.18 percent, Coinbase 25.59, MARA 22.39. Reading them as risk appetite returning and reading them as a mirror of the dollar are different claims, and this week's evidence favours the second.
Here is what would kill it: if the dollar rebounds next week and those three keep climbing, the mirror reading does not hold.
[The Tail] A Second Measure Says the Same Thing
The fence measures how far price actually travelled. There is another measure for what the extreme costs.
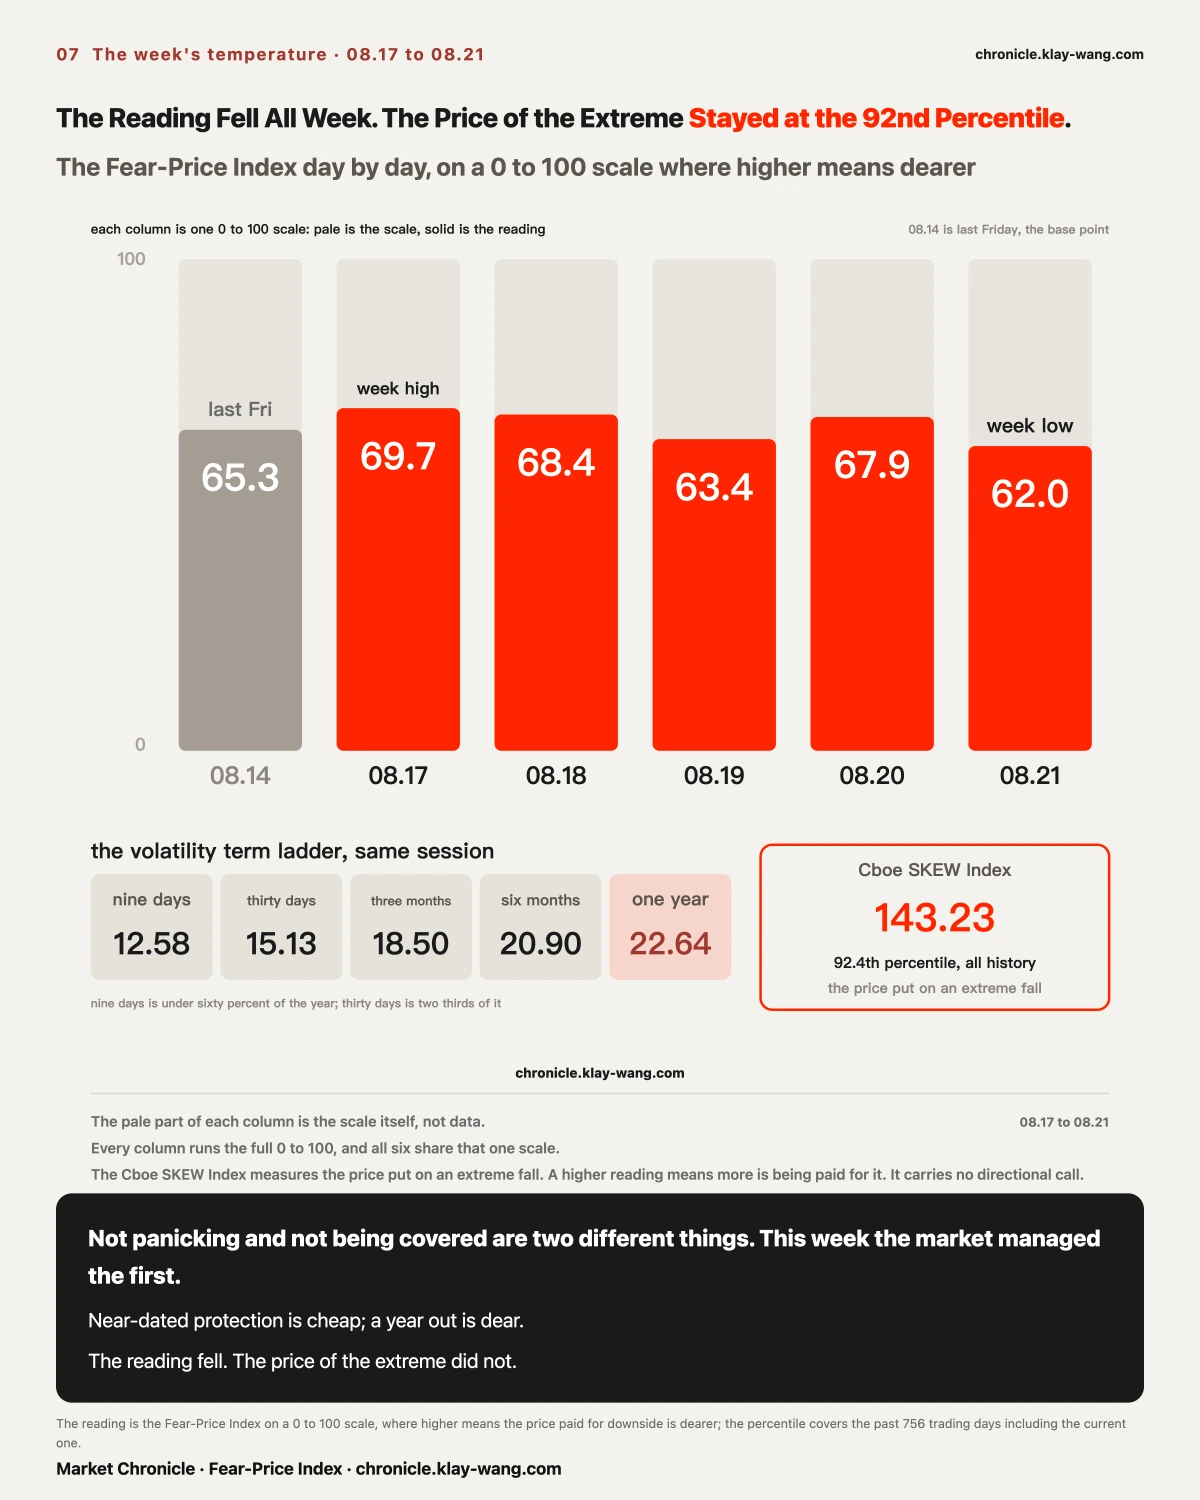
At Friday's close the Cboe SKEW index printed 143.23, in the 92.4th percentile of its full history. That index is derived from out of the money S&P options, and a higher reading means the market is paying more for a tail decline.
The volatility term ladder the same day: nine day 12.58, thirty day 15.13, three month 18.50, six month 20.90, one year 22.64. The thirty day sits at two thirds of the one year and the nine day does not reach six tenths of it.
The near end is cheap, the far end is not, and the price of the extreme is near a historical high.
The Fear-Price reading ran 65.3, 69.7, 68.4, 63.4, 67.9 and 62 across the week, peaking Monday and bottoming Friday, never once entering high territory. Unafraid and unhedged are two different states. This market managed the first one.
[Participation] The Names That Rose Cannot Be Written as a Group
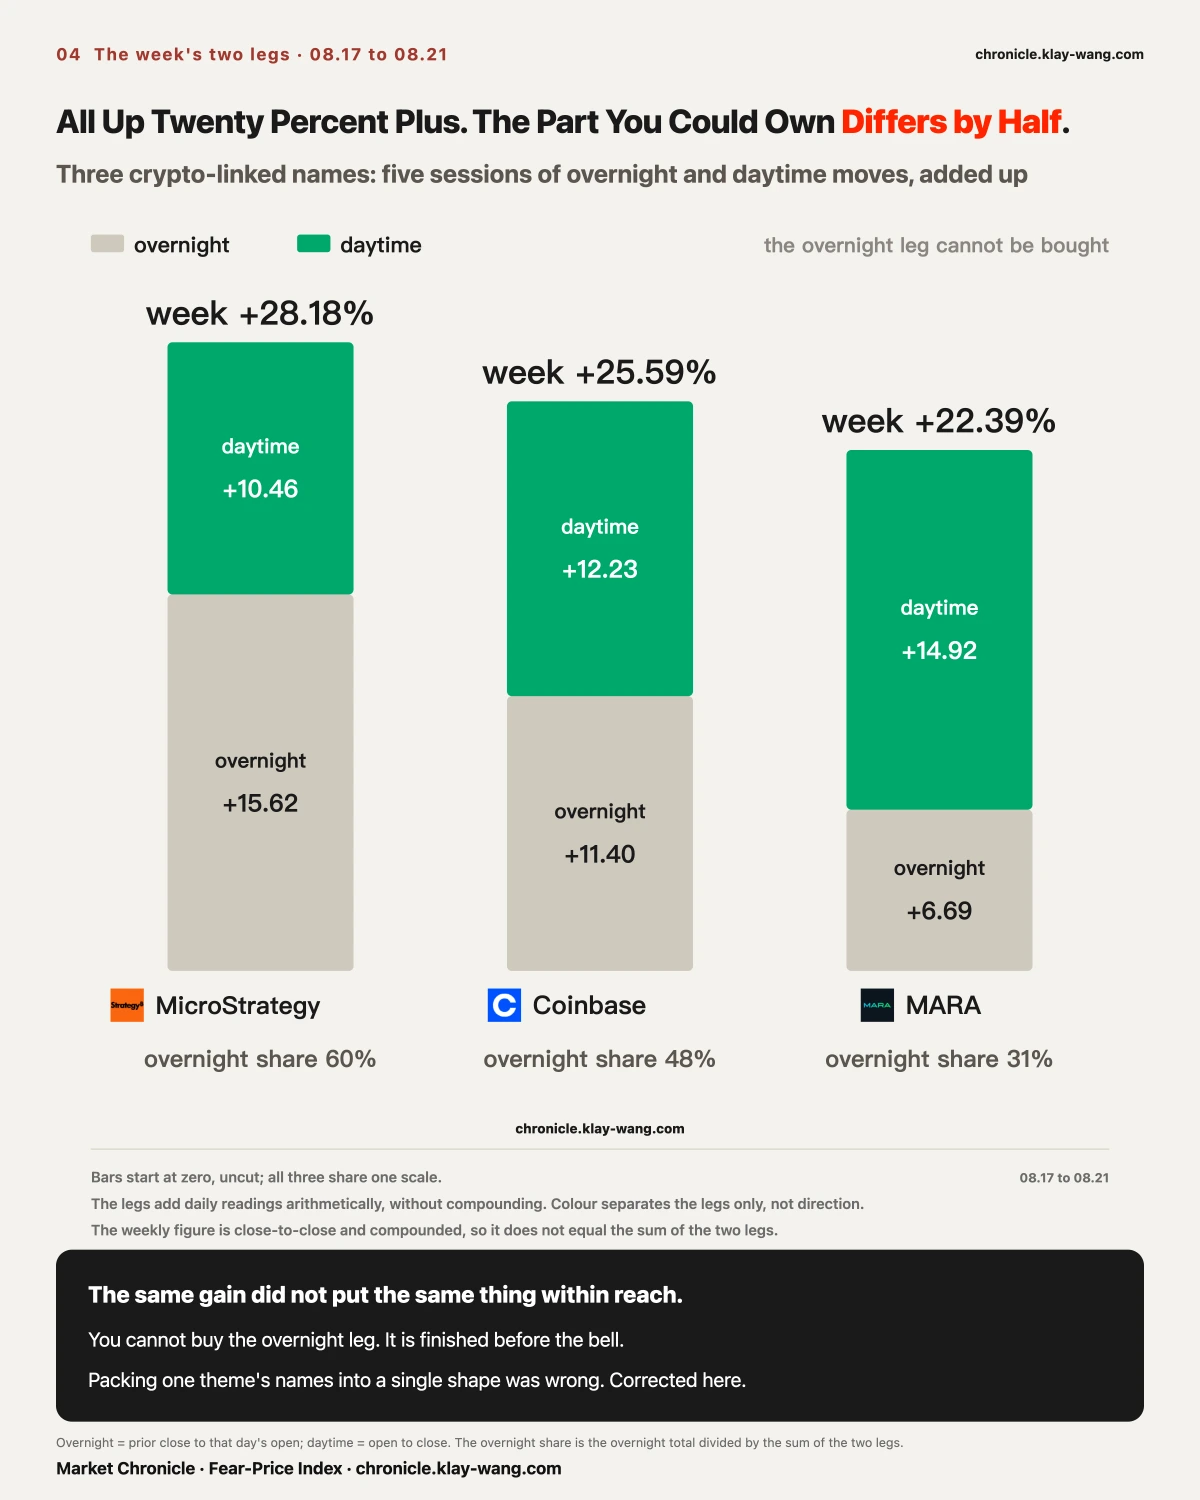
The strongest names of the week were the three crypto proxies. MicroStrategy up 28.18 percent, Coinbase 25.59, MARA 22.39.
Split them the same way and they are nothing alike. MicroStrategy's overnight legs total 15.62 against 10.46 during hours, so most of it happened while you could not trade. Coinbase runs 11.40 and 12.23, roughly even. MARA runs 6.69 and 14.92, mostly during hours.
On Wednesday and Thursday we described a shape where gains were concentrated in the gaps and wrote that the move was there but the participable part was not. Across the full week that only holds for MicroStrategy.
Names under one theme can differ by half in how hard they are to actually own. Packing them into one shape was wrong, and that gets corrected here.
[Memory] Four Markets, Four Answers
The narrative side of the storage names ran hot all week.
SK Hynix filed formally after the Korean close on August 19: a buyback and cancellation of 40 trillion won covering 24.07 million shares, 3.3 percent of shares outstanding. That is the largest buyback in the history of Korean listed companies, and the only one of these items where a company spent its own money on itself.
Samsung's shareholder return plan was reported repeatedly during the same week in a range of 90 to 110 trillion won. The final figure belongs to the company's own filing and the top of the range is not treated here as settled. Micron disclosed a research lab plan of roughly 10 billion dollars over a decade. SanDisk launched a new storage line.
Bank of America, citing EPFR, put semiconductor ETF outflows at a third consecutive week and 6.3 billion dollars cumulative.
On the cash tape, Micron and SanDisk traded 0.54 and 0.43 times their twenty day average on Friday.
On the options tape, SanDisk held the single heaviest contract of Friday, the August 28 1600 call at 14.09 million dollars, trading at 2.4 times its open interest.
Narrative is bullish, fund flow is bearish, the cash tape is watching and the options tape is betting. Four markets, four answers, one set of companies. When all four disagree, noticing that they disagree is worth more than picking one of them.
[Next Week] Two Things Land on the Same Day
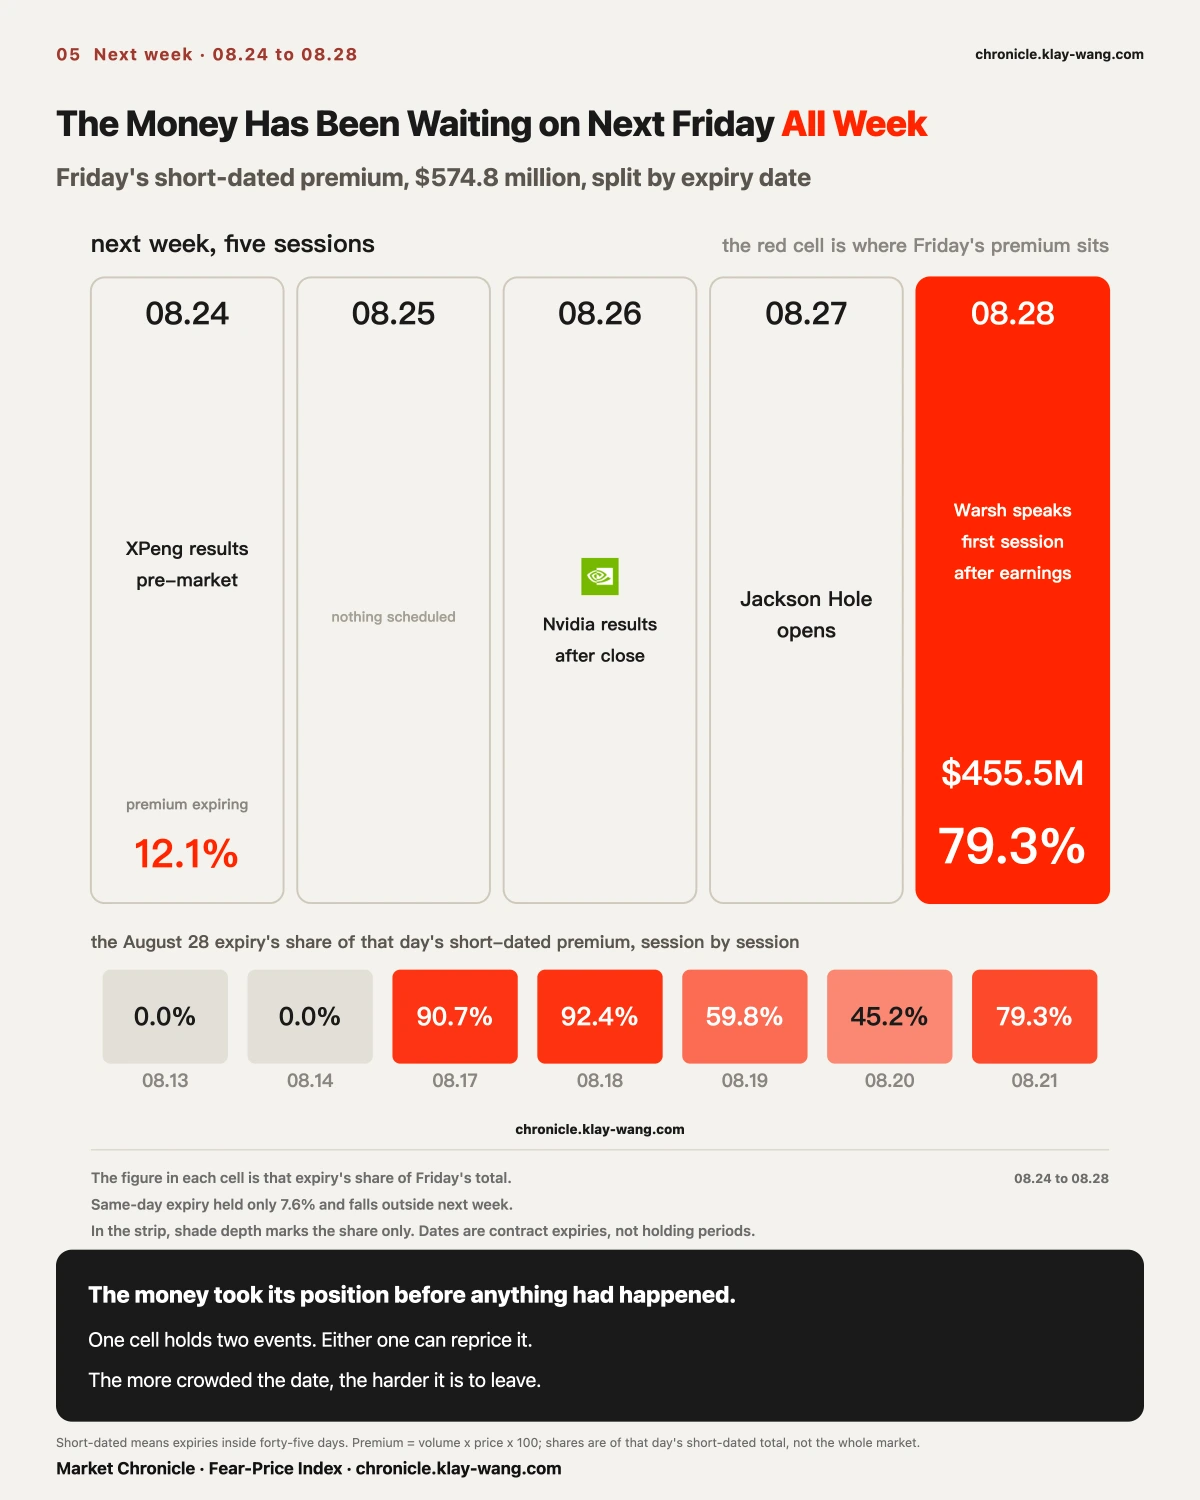
On Friday, 79.3 percent of the 574.8 million dollars of short-dated premium sat on the August 28 expiry. That date has been this market's focal point since August 17, interrupted on two sessions out of five.
Nvidia reports after the close on August 26 and the 28th is the first session after the print. The same week, Jackson Hole opens on the 27th and Warsh gives his first address as Fed chair on the 28th.
Warsh took over from Powell in May and has still not described what would make him move rates, while inflation has run above the 2 percent target for five straight years and the funds rate sits at 3.50 to 3.75 percent. The market has to digest a print and hear this man speak for the first time, on the same day.
Of Tesla's 164.3 million in premium, 162.7 million also sits on August 28, all of it in calls, laddered from 340 to 380. The money has been waiting there for a week.
What This Means for What You Hold
No recommendations. Just this week's prices converted into something you can judge for yourself.
If you hold something that has closed near its low several sessions running: check whether it closes in the same place each day and whether the decline happens during hours. One session means nothing. Three on the same rhythm means that seller probably is not finished, or has just finished. Reddit stopped on the fourth day.
If you hold something that ran hard this week: split it before celebrating. Two names both up twenty percent plus can differ by half in how much of it you could have owned.
If you hold storage names: four markets gave four answers this week. When they all disagree, position size matters more than opinion.
If you hold nothing and are waiting for an entry: the downside half of the fence got used six to seven tenths all week while the thirty day insurance costs two thirds of the one year. The market thinks nothing happens next week and is paying a historically high price for the improbable anyway. That combination is falsifiable, and next week will do it.
Three Lines Worth Keeping
Reddit fell 13.92 percent on the week and its overnight legs total minus 0.76. It was sold during hours, one session at a time, and it stopped on the fourth day.
Bonds owned every headline and the twenty year plus Treasury ETF netted 0.01 percent on a 2.30 percent range, the sixth widest week in 39. It did not stand still. It went around and came back.
Micron swung 12.45 percent across the week and finished down 0.50, which makes the swing 24.8 times the net move. A leaderboard only records the second number.
Fear-Price Index · 2026-08-21 · reading 62/100: one-year volatility VIX1Y at 22.64, the 62nd percentile of the last three years, where higher means dearer. Daily ledger and methodology at chronicle.klay-wang.com · Credit: Fear-Price Index · Market Chronicle
No investment advice. No direction calls. No market timing.