Oct 5 to Oct 9 Weekly Review: Chips Fell 4.3% and the Compute Borrowers Fell in Stocks and Bonds. Who Is Buying Insurance Ahead of a Second Hike?
Three Lines: Ordinary Insurance Eased, Crash Insurance Got Dearer, and Prices Did Not Come Back
- The price of protection on rates jumped to 113.6 on Monday and was 98.5 on Friday; the price of insurance against a crash rose from 143 to 154 over the week, the 98th percentile of its history.
- The makers and compute renters on the AI chain fell nearly 10% over the week; utilities, staples, energy, health care and software each rose 2.8% to 4%.
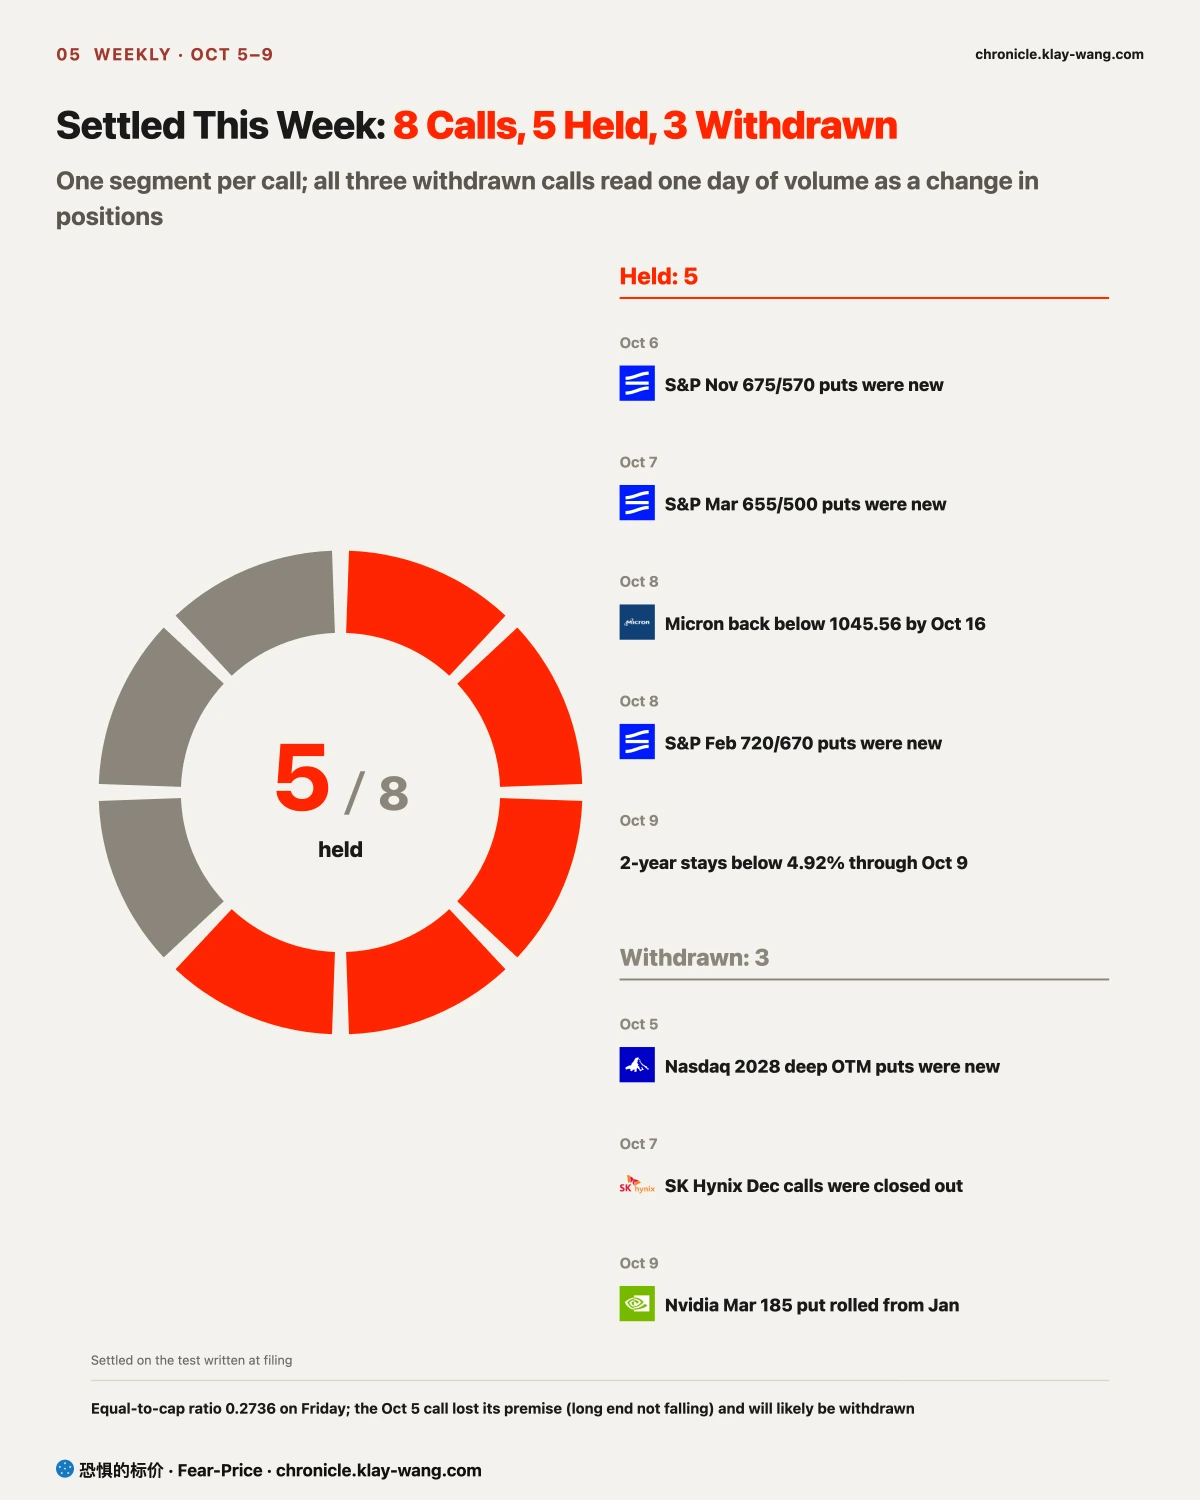
- Eight calls settled this week: 5 held and 3 were withdrawn; all three withdrawn calls read one day of volume as a change in positions.
Fear-Price Index 41.4: One-Year Protection Did Not Move, and the Price of Crash Insurance Hit the 98th Percentile
Fear-Price Index · Oct 9, 2026 · 41.4/100: one-year volatility VIX1Y at 21.73, in the 41.4th percentile of the past three years, where high means expensive. Daily ledger and definitions at chronicle.klay-wang.com · Please credit: Fear-Price Index
Taken together, the five days show the market doing two things: repricing companies that need someone else to pay them before they can repay, and buying insurance ahead of a second hike.
First, the temperature. The week had three days of sharp moves: on Monday the 10-year Treasury yield reached 5.31%; on Wednesday long bonds pushed again, the 10-year touching about 5.35% during the day and the 30-year closing at 5.67%, its highest close since 2002; on Thursday oil and the OpenAI revenue definition hit chips together, and one-month protection on SMH rose to 35.42, the highest since records began in mid-September.
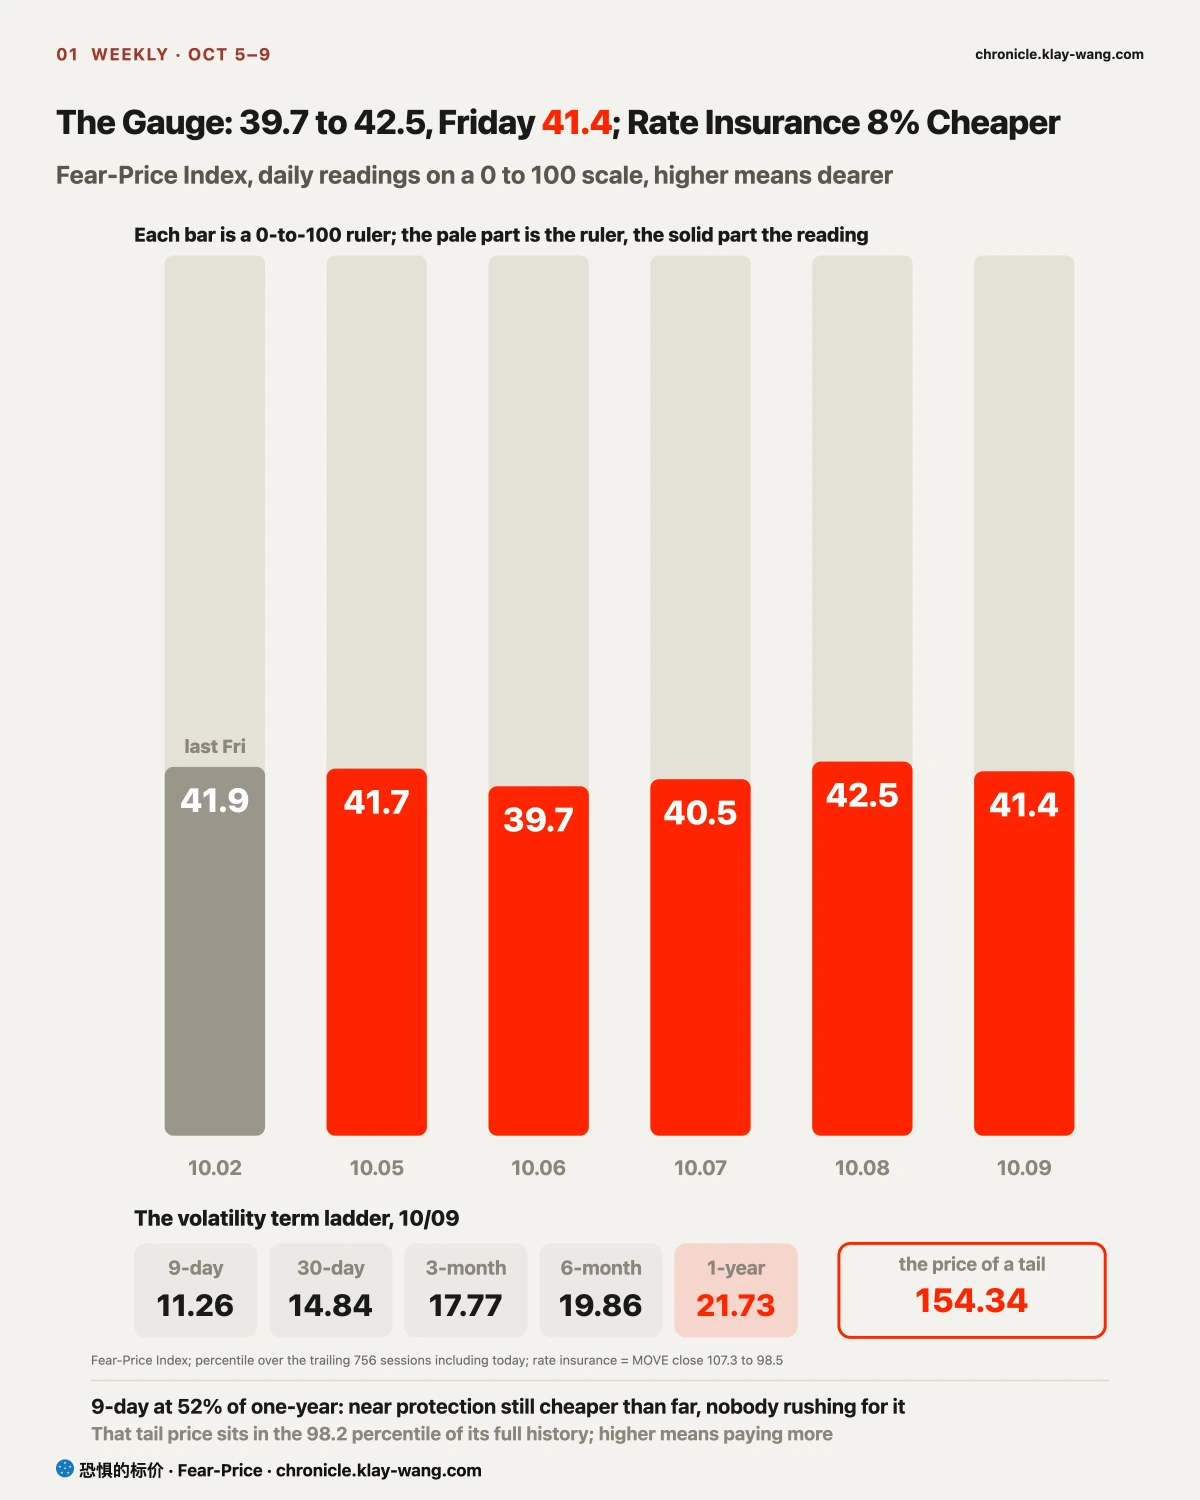
The price of a year of insurance on US stocks barely moved. The reading went from 41.9 last Friday to a low of 39.7 on Tuesday and 42.5 on Thursday, closing at 41.4 on Friday; one-year volatility VIX1Y stayed between 21.65 and 21.76 all week. The September 18 issue said one-year protection only gets expensive above 23; on Friday it was 21.73, 1.3 below. None of the three scares reached the one-year horizon, yet crash insurance got dearer: SKEW, the price set on a large fall from options within a month, rose from 143.04 to 154.34 over the week, the 98th percentile of its history, while the VIX fell from 15.52 to 14.84. The K index is 3.03 (provisional), above the 2.61 final for last Friday; the closer it gets to 1, the more worry is turning into protection bought, and at the Friday Fear and Greed reading of 45.0, the VIX would have to rise above 45.0 for K to fall below 1. History at chronicle.klay-wang.com/kindex, the index at chronicle.klay-wang.com/fear-price.
[Rates] On Closing Prices the 10-Year Peaked Monday; Far-Dated Long Bond Calls Surged, and Monday Open Interest Will Show if the Bet Is New
The rates worry this week spiked and then faded. On Monday the 10-year Treasury yield rose from 5.28% last Friday to 5.31%, and the price of protection on rates jumped from 107.3 to 113.6; that price fell every day after, to 98.5 on Friday, 8% cheaper than last Friday. The 10-year closed between 5.22% and 5.28% on those four days, at 5.24% on Friday.
Wednesday was the tightest day for the long end: the 10-year touched about 5.35% during the day and the 30-year closed at its highest since 2002. That day a 39 billion dollar 10-year auction cleared at 5.300%, the most expensive since 2000, yet demand was solid, with indirect bidders taking about 80%, and the long end was caught near 5.3%. The minutes of the September meeting, released the same day, said according to media reports that most officials saw another hike as likely appropriate by year-end. The 2-year went from 4.83% to 4.80% over the week, and the call settled on Friday (closing below 4.92% every day through October 9) held: the short end did not climb further after the minutes. According to market pricing cited in an October 8 Bank of America report, the chance of an October hike is about 17% and of a December hike about 80%, so a second hike is already priced by year-end and the market is betting against October; the October 28 meeting settles the timing.
Far-dated long bond calls surged, but it is too early to call it a new bet. This week long bond fund calls expiring more than a year out traded about 590000 contracts, nearly ten times the puts; on Friday the January 21, 2028 95 and 100 calls traded 184000 and 223000 contracts, about 33 million dollars together. The 100 strike already had about 400000 contracts open and the two volumes were close, so it may be a roll or one spread, buying the 95 and selling the 100; Monday morning open interest will tell. The fund closed at 77.98, and reaching 95 would take a large drop in the 10-year. The direction of money toward bonds and cash is clearer: according to flow data cited by Bank of America, US Treasury funds took in 16.6 billion dollars this week, the most since April 2025, and money market funds 166.4 billion, the most since April 2020. Near term the market prices another hike; if someone far out really is betting on lower rates in a year or two, both can be true: hike first to push inflation down, then rates come lower.
Companies that borrow to expand fell the most this week (see Credit); what weighs on them is who pays them and how much more they need to borrow, and a small dip in rates does not help. Stock prices and long bond yields are both at extremes: the S&P hit an intraday record on Tuesday and ended Friday less than 0.4% below it, while the 10-year yield sits near its highest since 2002. Of the two, the bond market reaches further: the 10-year is the benchmark for mortgages, corporate borrowing and government interest, and stock valuations are discounted with it too; the longer it stays above 5%, the more people it reaches, even those who hold no bonds at all. If you hold long Treasuries, the call that the 10-year closes above 5% on October 30 had 24 basis points of room on Friday; the auction showed buyers near 5.3% and the minutes point to another hike, so the 10-year is more likely to swing between 5% and 5.4%.
[The Week] The AI Chain Is Being Re-Ranked by Who Gets Paid First, the Makers Took the Hit, and Defensive, Energy and Software Sectors Gained Most
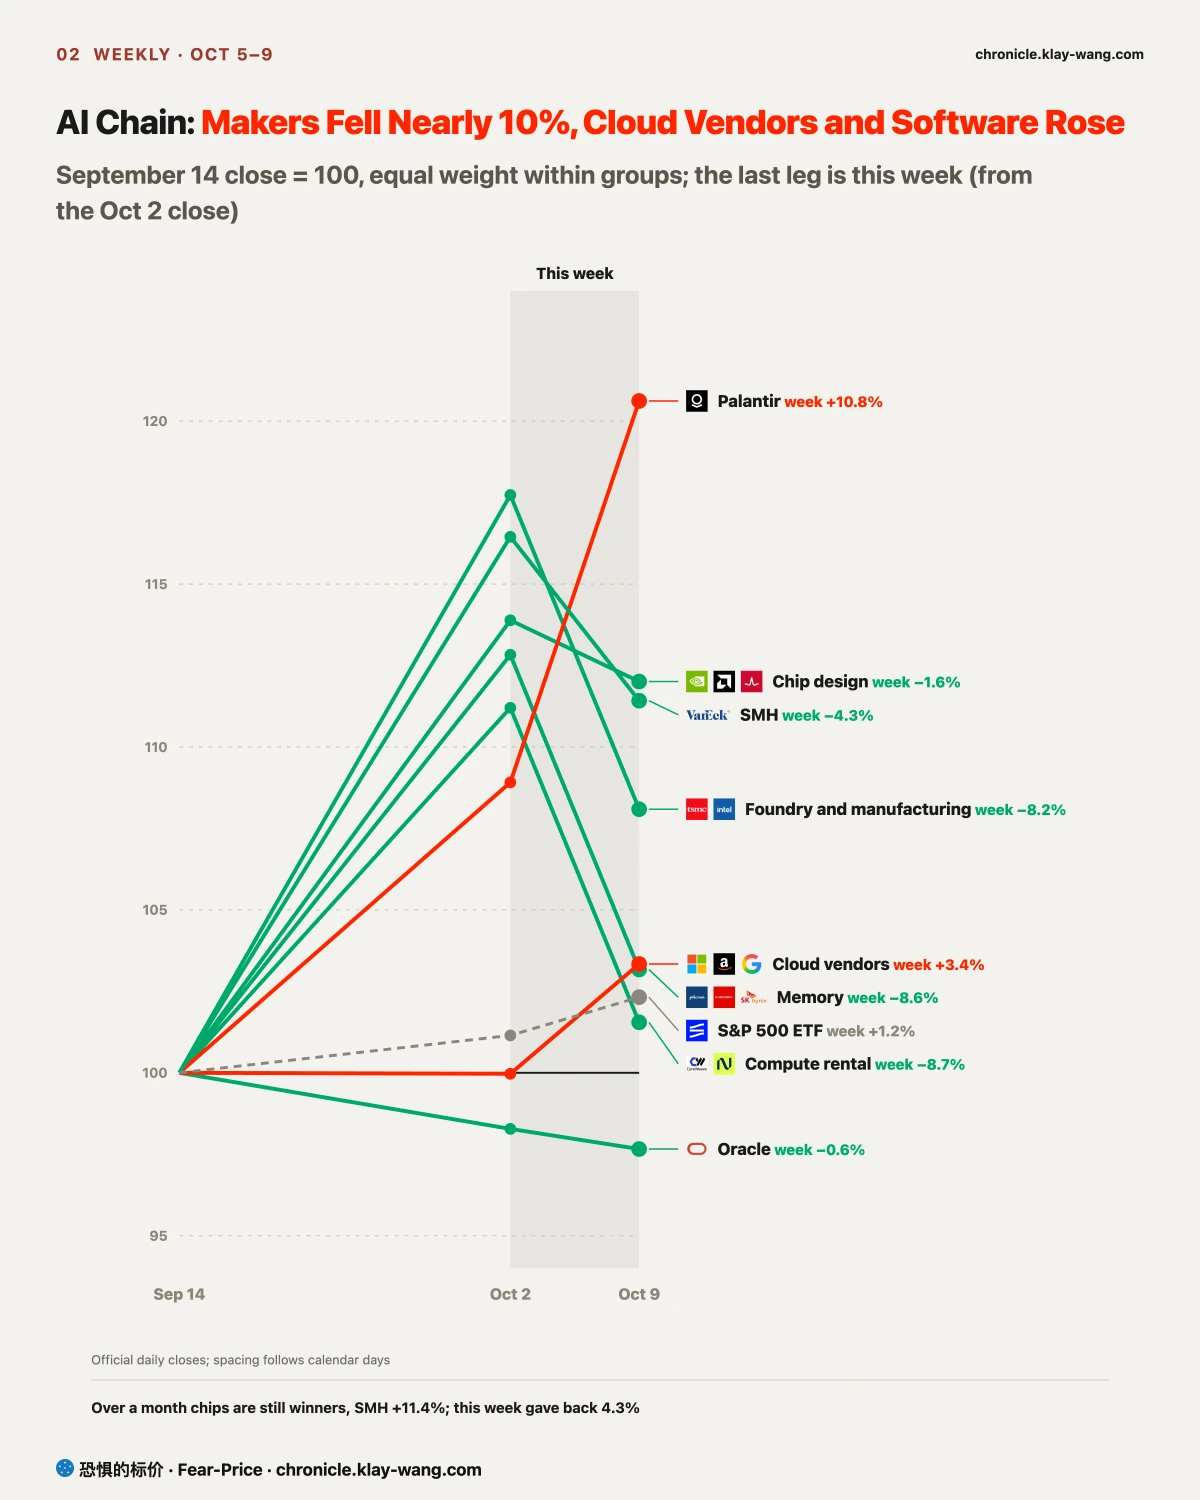
Grouped along the AI chain over the week, the losses were in memory, foundry and manufacturing, and compute rental, each down more than 8%, Intel alone 12.3%. The gains came at the end with customers of its own that collects the money: the three cloud vendors (Microsoft, Amazon, Alphabet) rose 3.4% equally weighted, Palantir 10.8%. SMH fell 4.32%.
By sector, utilities, staples, energy and health care each rose 2.8% to 4.0%, the software fund rose 3.9%, and the equal-weight S&P beat the cap-weighted one. On flows we can only see creations and redemptions in sector funds: in the week through October 8, the S&P 500 ETF saw net outflows of about 2.7 billion dollars, the technology sector fund net inflows of about 1.4 billion and utilities about 0.5 billion. Money did not leave technology; the shift from chips to software has no flow data.
Over a month, chips are still the winners. From September 14 SMH is still up 11.4%; this week gave some back from a high. What did not rise over the month is the segment that borrows to build compute: CoreWeave and Oracle are both down over the month.
On memory, one line is clearer over a longer stretch: on September 30 Micron beat on revenue, profit and guidance and the stock did not rise; rebounds on October 1 and October 7 did not hold, and by October 9 Micron was down 3.4% and SanDisk and SK Hynix 8% to 9%; one-year protection on Micron, SanDisk and SK Hynix fell about 9 to 10 points over the month, sellers calm and buyers not chasing. This week brought the first piece of evidence from the demand side: according to reports, Apple asked suppliers to cut component orders for the iPhone 18 Pro line by at least 15% because higher memory costs pushed up prices and hurt demand; the same week Micron raised its buyback ceiling to 35.16 billion dollars (10-K). The two point in opposite directions, and the next test is the TSMC report on October 15.
The split has one thread. When OpenAI revenue shrank on a new definition on Thursday, the market began ranking the segments by who gets paid first. On October 10 Bloomberg spelled out the gap in definitions: Anthropic counts the full amount sold through cloud platforms such as Amazon as revenue, while OpenAI counts only its share from partners such as Microsoft, so the two annualized revenue figures cannot be compared directly. The order: those selling chips, equipment and compute rental count orders only when customers pay; platforms own the customers and decide for themselves how much to spend. The Friday trading ran the same ranking again: chips opened higher and slid all day, while software, cloud and payments rose all day. Big tech capital spending guidance at the end of October is the test: if they keep raising spending, the makers come back; if they start cutting, this week was the beginning.
[Credit] AI Issuers Eased Overall, the Widest Moves Came From Those Borrowing to Build Compute, and High Yield Kept Widening
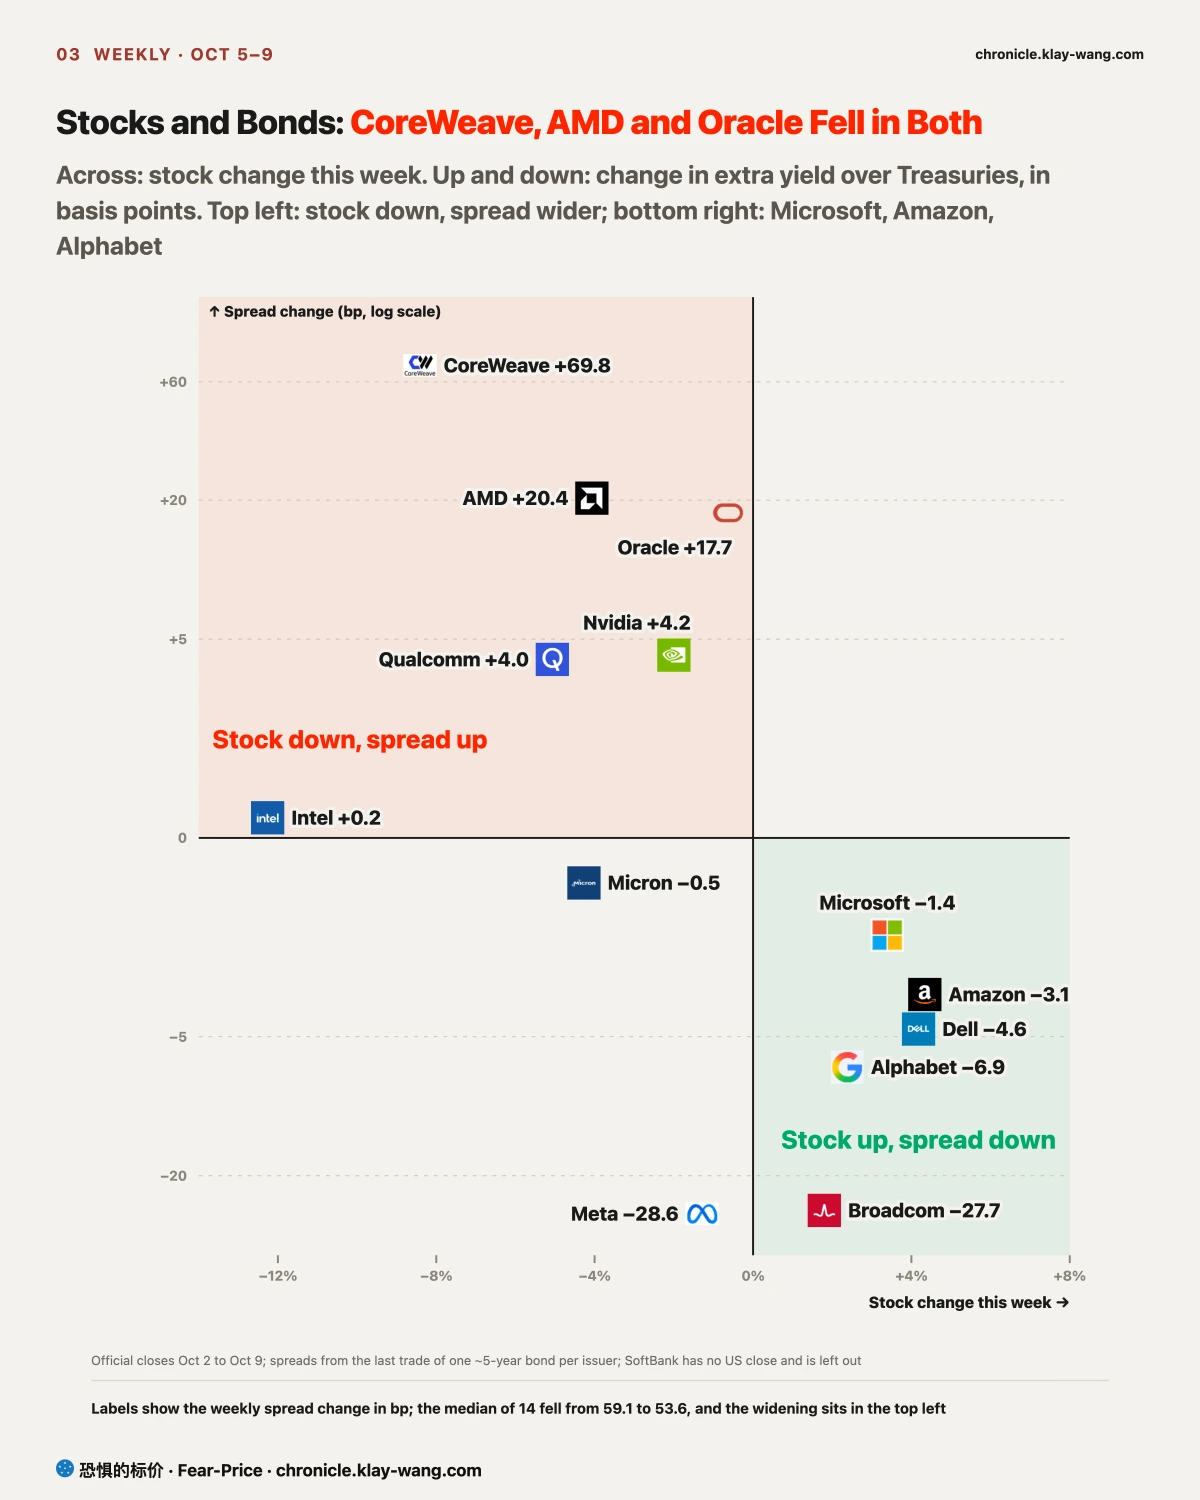
AI issuers eased overall this week: across the 14 we track, the median extra yield over Treasuries fell from 0.59 to 0.54 percentage points; the three that widened most were CoreWeave, AMD and Oracle, with the CoreWeave 2031 bond adding 0.7 percentage points over the week to about 9. Meta and Broadcom narrowed most, by nearly 0.3 percentage points each (based on the last trade of a single bond; thinly traded bonds can swing more over a week). The wider high-yield market did not ease with them: its spread rose from 3.10% last Friday to 3.15% on Thursday, half a point above the 2.65% of mid-September.
Reports the same week showed borrowing for chips getting larger: according to The Wall Street Journal, Broadcom is arranging more than 50 billion dollars of financing for the custom chips it builds with OpenAI, and Oracle is in talks with Apollo and Goldman Sachs on chip financing; according to the Financial Times, SpaceX wants to raise about 40 billion dollars to buy Nvidia chips, about 30 billion of it in investment-grade bonds. As calculated by The Wall Street Journal, Nvidia holds stakes in 242 companies including OpenAI and Anthropic, which also buy its chips; take out those investments and the cash spent on employee stock awards, and free cash flow at Nvidia for the first half of its fiscal year falls from 69.9 billion dollars to about 21.7 billion, while long-term debt rose 24.9 billion over the same period. The bond market priced them differently: Oracle widened, Broadcom narrowed, and the SpaceX 2031 bond barely moved. The dividing line is whether the company as a whole depends on customers such as OpenAI paying: the Broadcom financing is tied to OpenAI, but its own cash flow does not rest on one customer. CoreWeave options say the same thing: puts expiring more than a year out traded 2.3 times the calls.
We wrote this line on September 10: big tech pays for capital spending with bonds and customer prepayments, heavy issuance lifts the long end, and when rates rise, those that borrow heavily and earn back slowly are repriced first, until it comes back to the issuers that borrowed to expand and their suppliers (settles October 31). The next reading is the rate and terms on these chip financings.
[Insurance] Far-Dated Index Protection Was All Bought for After October 28, and Most of the Thursday Batch Did Not Stay
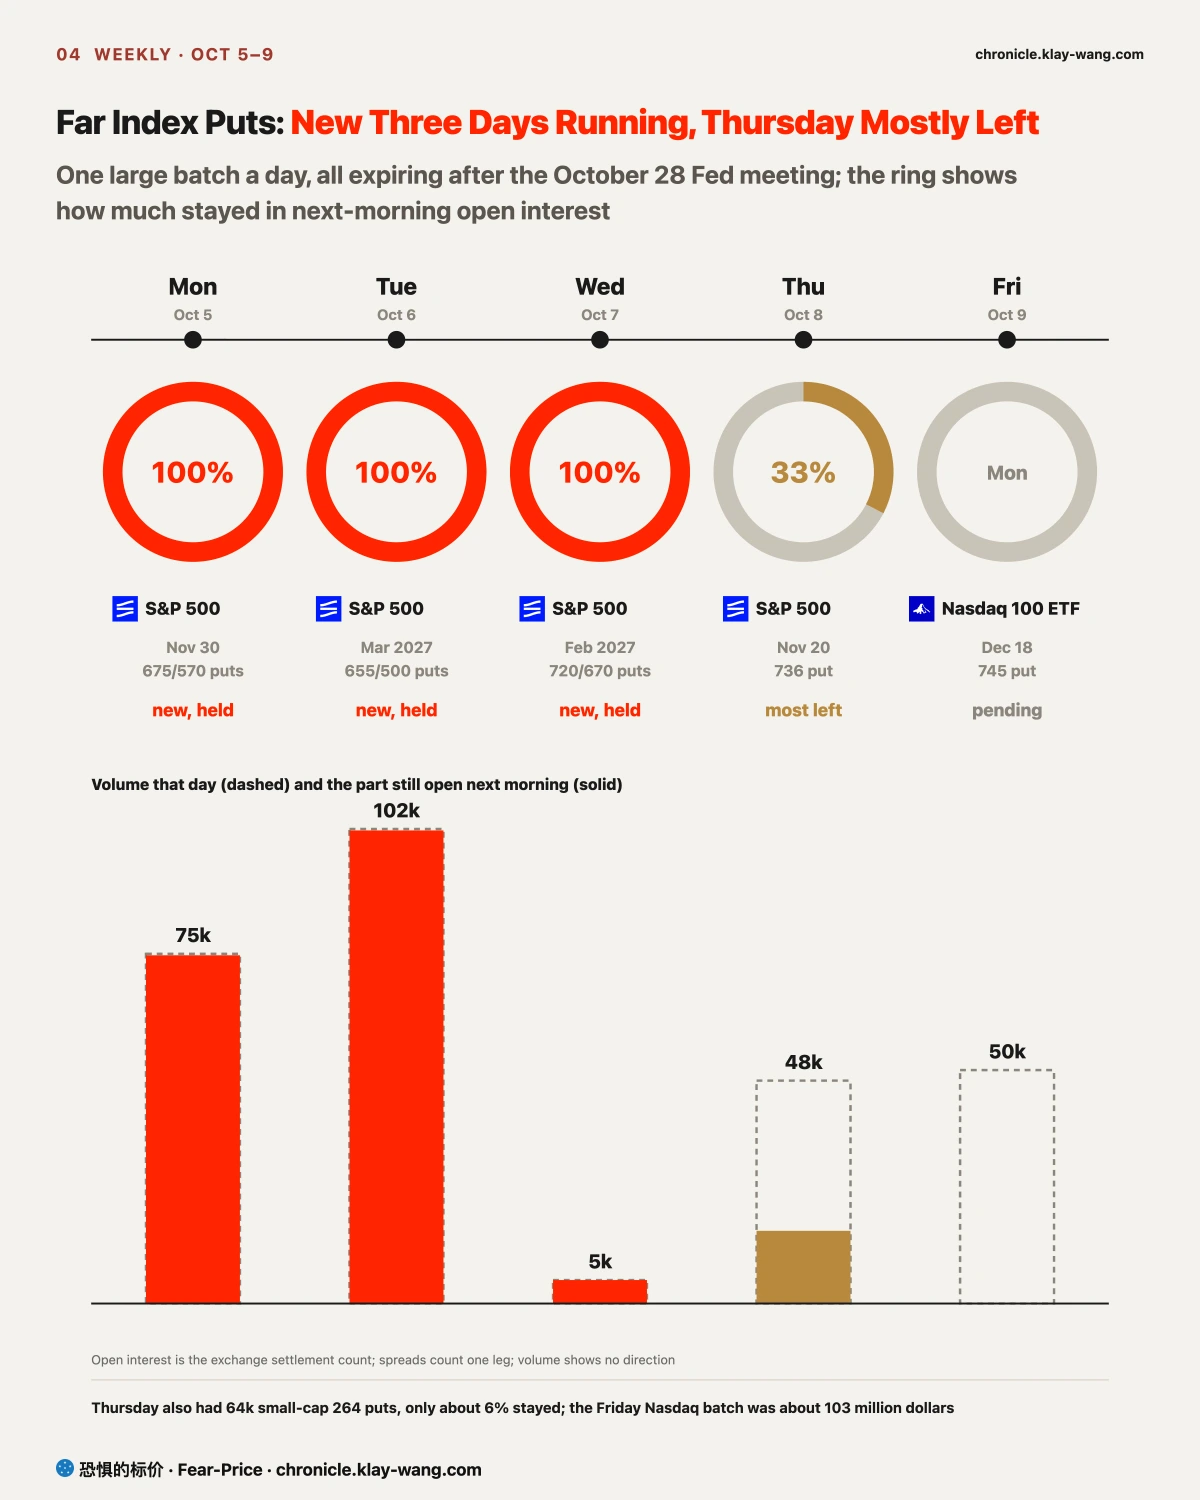
Every day this week large orders bought downside protection a little further out on the index, and next-day open interest separated the real from the passing. On Monday it was the S&P November 30 675 and 570 puts, about 75000 contracts each; on Tuesday the March 2027 655 and 500 puts, about 100000 each; on Wednesday the February 2027 720 and 670 puts, about 5000 each. All three batches kept more than 99% in next-day open interest, new protection, and all three calls held.
The Thursday batch was different. The S&P November 20 736 put traded 47800 contracts, and Friday morning open interest rose only 15600, about a third; the small-cap 264 put traded 64000, and open interest rose only about 3800. Most of it was day trading, and the Thursday line that someone was buying every day this week should read: the first three days were new, and most of Thursday did not stay. On Friday it switched to the Nasdaq 100 ETF December 18 745 put, 50100 contracts, about 103 million dollars, against prior open interest of only 3549; Monday morning shows how much stayed.
Every one of these batches expires after the October 28 Fed meeting: November 20, November 30, December 18, February and March, and all of them also span the November 3 midterm election. The September 18 weekly review said the stretch between the first and second hike would most likely swing back and forth, and that protection should be bought before the second. Three weeks ago that was a reminder; this week someone actually did it. The February and March batches span the December meeting, so a second hike at year-end falls inside their term; the November batches cover the October meeting and the election. Crash insurance within a month reached the 98th percentile the same week, pointing the same way. The S&P closed at 778.57 on Friday, 2.2% above the 761.69 of September 18, still within the 5% of that call.
Single stocks showed something else. Palantir rose 10.8% over the week while its one-month protection got about 9 points dearer: price up and options dearer means someone is chasing or hedging with options, and the move is crowded. Chips were the opposite, with prices down and protection cheaper on Friday: sellers were in no hurry.
[Holdings] What This Means for What You Hold
If you hold the S&P 500 or Nasdaq 100 ETF: 10000 dollars in the S&P 500 ETF made about 116 dollars this week, the Nasdaq 100 ETF about 23 and the equal-weight S&P about 158; a year of protection costs about what it did last week, crash protection got dearer, and someone is buying ahead of October 28.
If you hold chips or memory: still the winners over a month, giving some back this week; memory rebounds since September 30 have not held, and the Apple component cut is the first sign from demand pointing the other way. The TSMC report on October 15 and big tech capital spending at the end of October decide whether this segment comes back.
If you hold companies that borrow to expand (CoreWeave, Oracle): stock and bonds fell together and long-dated puts are heavy, so the market is asking about repayment; the next answers are the terms of these chip financings and big tech capital spending.
If you hold big tech or software: the gains were on your side this week; Palantir options keep getting dearer, so chasing costs more.
If you hold carriers: after SpaceX said it would buy the spectrum, the three big carriers fell 9% to 13% on Friday as the market priced the long run; whether T-Mobile gets back to 171.31 before October 16 is the first test.
[The Scorecard] Eight Calls Settled: 5 Held, and All 3 Withdrawn Read One Day of Volume as Positions
Three of the five that held were the same kind: new far-dated S&P put spreads, the Monday, Tuesday and Wednesday batches, each keeping more than 99% the next morning. Micron back below 1045.56 before October 16 held early on Thursday; the 2-year closing below 4.92% throughout held on Friday.
The three withdrawn calls went wrong in the same place, and it is not flattering: reading one day of volume as a change in positions. The Nasdaq 2028 deep out-of-the-money puts kept only about 40% of the volume from the previous Friday, since far-dated deep puts roll often; the SK Hynix December calls traded close to their open interest without the open interest falling, a change of hands; the Nvidia March 185 put was read as a roll from January, but the next day open interest in the January strike rose instead of falling, so both were new. Volume can mislead; next-morning open interest does not.
One open call has to be stated plainly: the October 5 call that the equal-to-cap-weight ratio closes below 0.2725 on October 16. Its premise was that the long end would not come down; this week the 10-year went from 5.31% back to 5.24%, so the premise did not happen. The ratio touched 0.2710 on Wednesday, bounced to 0.2738 on Thursday when the big AI names fell, and was 0.2736 on Friday. With the premise gone, the conclusion has turned too, and this call will most likely be withdrawn.
The Dates Ahead: TSMC Results and Monthly Expiry Decide Whether Chips Come Back
- October 12 (Monday) morning: whether the Nvidia February 2027 120 put were new, and whether the long bond fund January 2028 95 and 100 calls were new, a roll or one spread; Monday is Columbus Day, stocks open, bonds closed.
- From October 13 (Tuesday): big bank third-quarter results, JPMorgan, Citi and Wells Fargo first; one-month protection on regional banks got about 7.7 points dearer over the month.
- October 15 (Thursday): TSMC third-quarter results.
- October 16 (Friday): monthly options expiry; four calls settle on Marvell, the equal-to-cap-weight ratio, the VIX and T-Mobile.
- October 28 (Wednesday): Fed decision; whether the far-dated index protection is still held, and whether the S&P stays within 5% of 761.69.
- October 30 and 31: whether the 10-year is still above 5%; the call that big tech capital spending comes back on the spenders settles.
- November 3: the midterm election, which every one of the far-dated index put batches spans.
Three Lines Worth Keeping
- Ordinary insurance got cheaper, crash insurance reached the 98th percentile, and far-dated index protection was all bought for after October 28: someone is paying in advance for a second hike.
- The AI chain is being re-ranked by who repayment depends on: the makers and compute renters fell nearly 10%, the compute borrowers fell in stocks and bonds, and among sectors the biggest gains were in defensives, energy and software.
- Far-dated protection needs next-day open interest: the first three days were new, most of Thursday did not stay, and big volume does not mean anyone stayed.
No investment advice. No direction calls. No market timing.