Super Micro, Meta and Tesla: Not All AI Spending Becomes Cash
Three-Line Preview
- Large technology regained leadership. Super Micro, Dell, HPE and Vertiv rose together, while equal-weight performance and market breadth did not expand with them.
- Super Micro improved both revenue and margin, testing whether orders carry profit. Meta and Tesla sit farther along the spending path, where capex must return as free cash flow.
- One-month protection became cheaper, while long-dated crash insurance stayed expensive. Near-term events are settling; financing cost and long-run capital returns remain open questions.
Fear-Price Index 50.0: Calm Up Front, Expensive Crash Insurance Farther Out
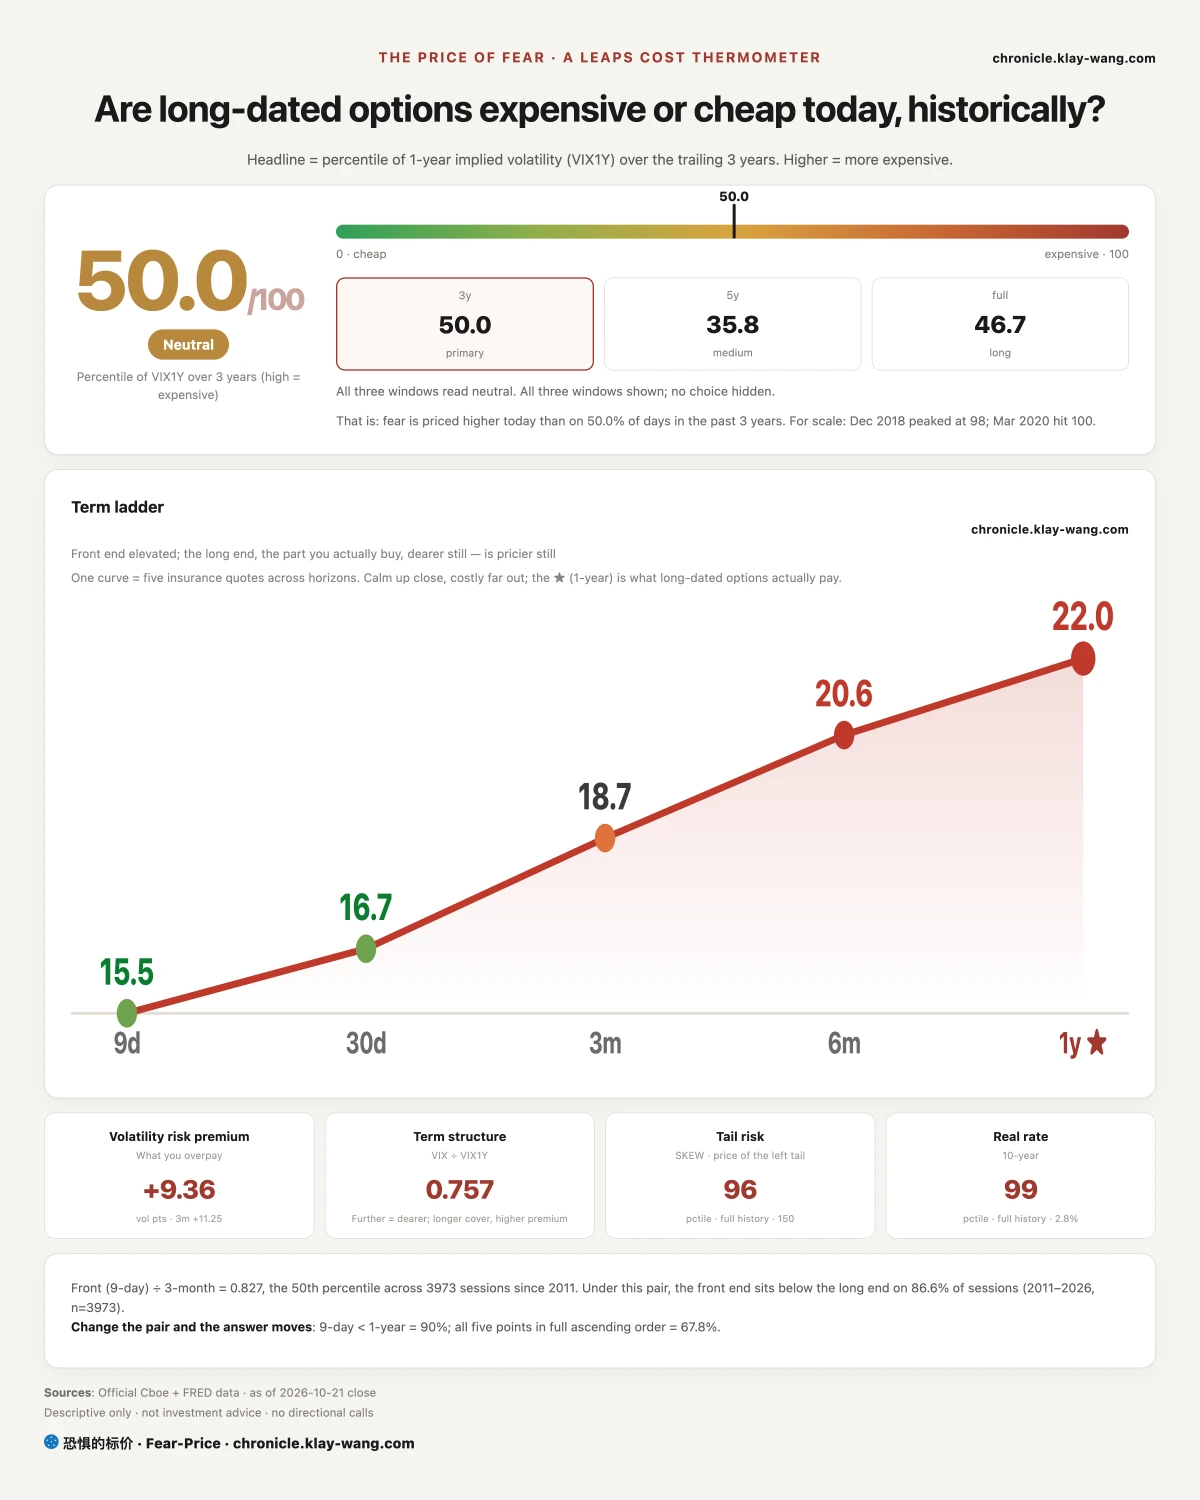
Fear-Price Index · 2026-10-21 · Reading 50.0/100: one-year volatility VIX1Y was 22.03, in the 50.0th percentile of the past three years, where high means expensive. Daily ledger and definitions at chronicle.klay-wang.com · Please credit: Fear-Price Index · Fear-Price
Nine-day protection was 15.49, below 30-day protection at 16.68 and one-year protection at 22.03. SKEW reached 150.36, in the 96.5th percentile of its full history. The market priced calm near-term trading while continuing to charge heavily for a deep decline.
The K Index rose to 1.881 from 1.708 on Tuesday. With Fear and Greed at 31.4, VIX would need to rise above 31.4 for K to fall below 1. History is at chronicle.klay-wang.com/kindex, and the index is at chronicle.klay-wang.com/fear-price.
Market and Lookback: AI Orders Lifted Hardware; Funding Charges Did Not Fall With It
The Nasdaq gained 1.05% and technology rose 1.67%, while the equal-weight S&P 500 added 0.36%. Only 281 of 503 names advanced, down from 404 a day earlier. Index strength concentrated in large technology and AI hardware.
Super Micro, Dell, HPE and Vertiv gained 9.55%, 5.27%, 3.71% and 4.22%. HPE sells servers, hybrid cloud and enterprise networking; Vertiv supplies data-center power and cooling. They are separate companies. All four closed below their opening prices, while Nvidia and AMD closed above theirs. Demand improved across servers and power equipment, but intraday follow-through was stronger in chips.
Oracle fell 1.53%, CoreWeave lost 0.50%, and Nebius was nearly flat. The Dell credit spread held near 89 basis points, Oracle near 258, and CoreWeave near 1009. A credit spread is the extra interest a company pays over Treasuries. Equity improved before creditors broadly lowered the cost of debt-funded expansion.
The dollar was nearly flat, long Treasuries rose modestly, oil and copper fell, gold edged higher, and bitcoin and ether gained. MOVE fell from 101.69 to 95.94. Cross-asset prices did not support a broad growth-and-inflation acceleration, leaving company orders, profit and financing as the stronger evidence.
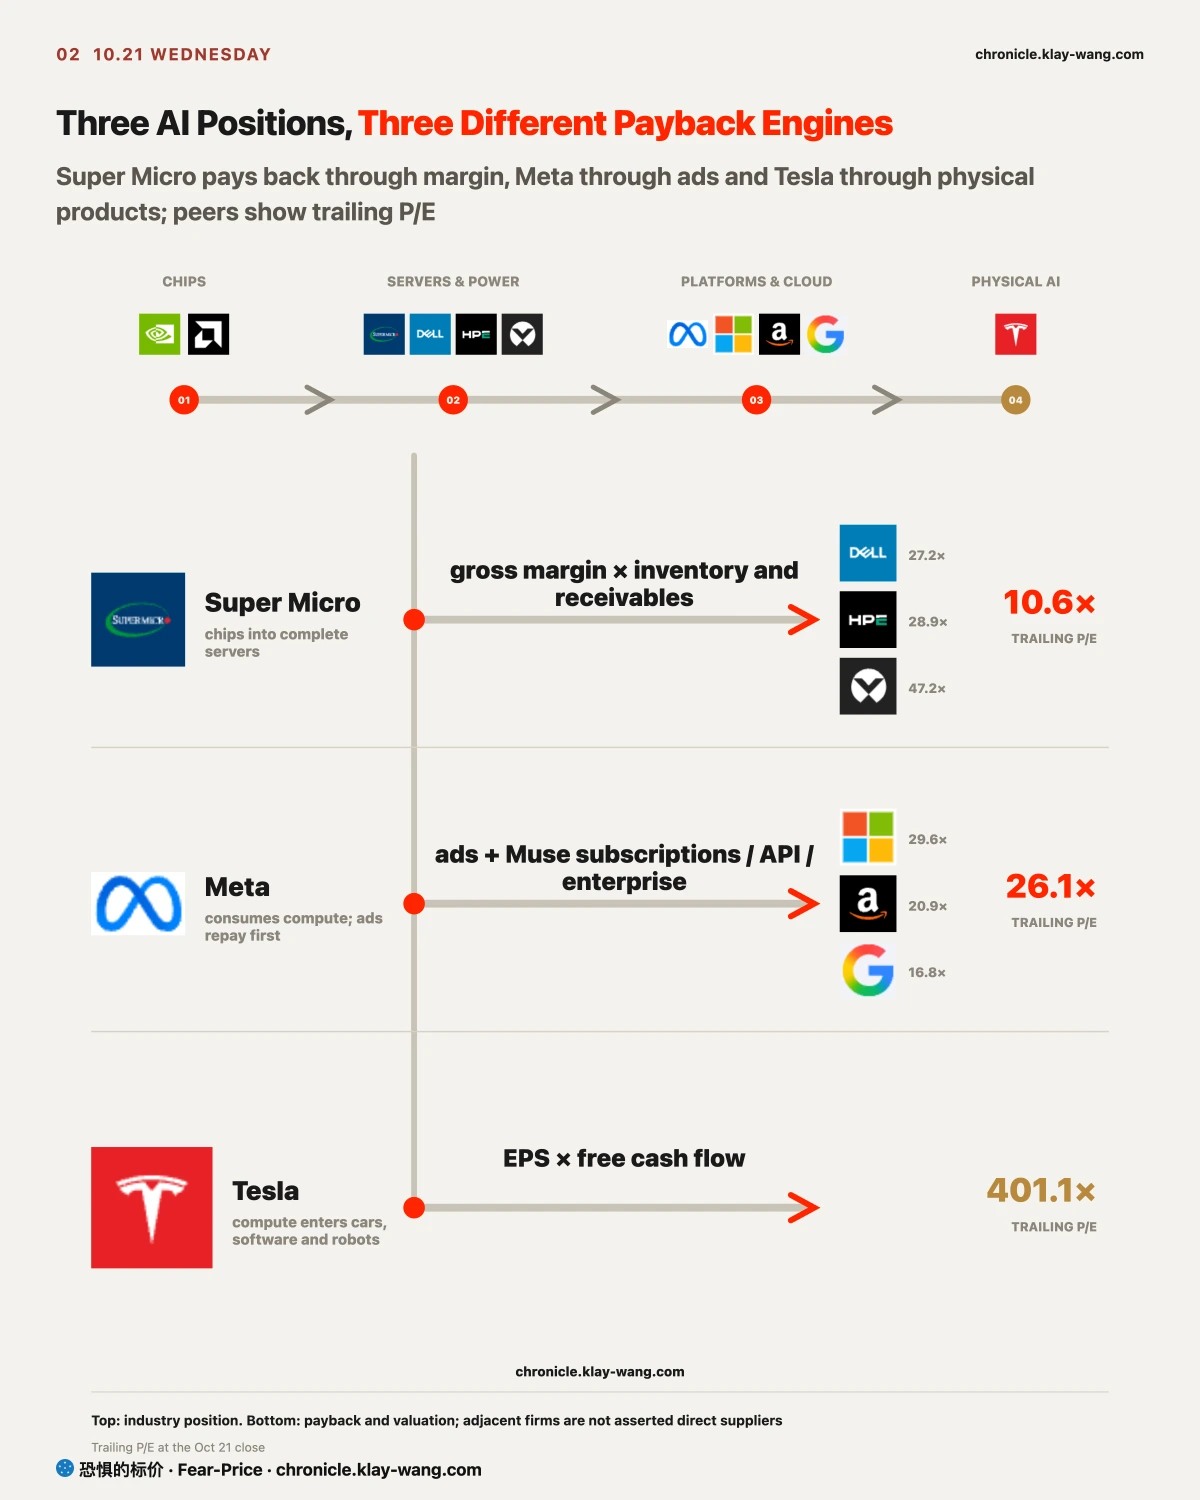
The three protagonists occupy different positions. Super Micro turns chips and components into servers. Meta buys compute and monetizes it through advertising. Tesla puts compute into vehicles, autonomy and robotics. They share AI demand but face different operating constraints.
Super Micro: Estimated Gross Profit Grew Faster Than Revenue
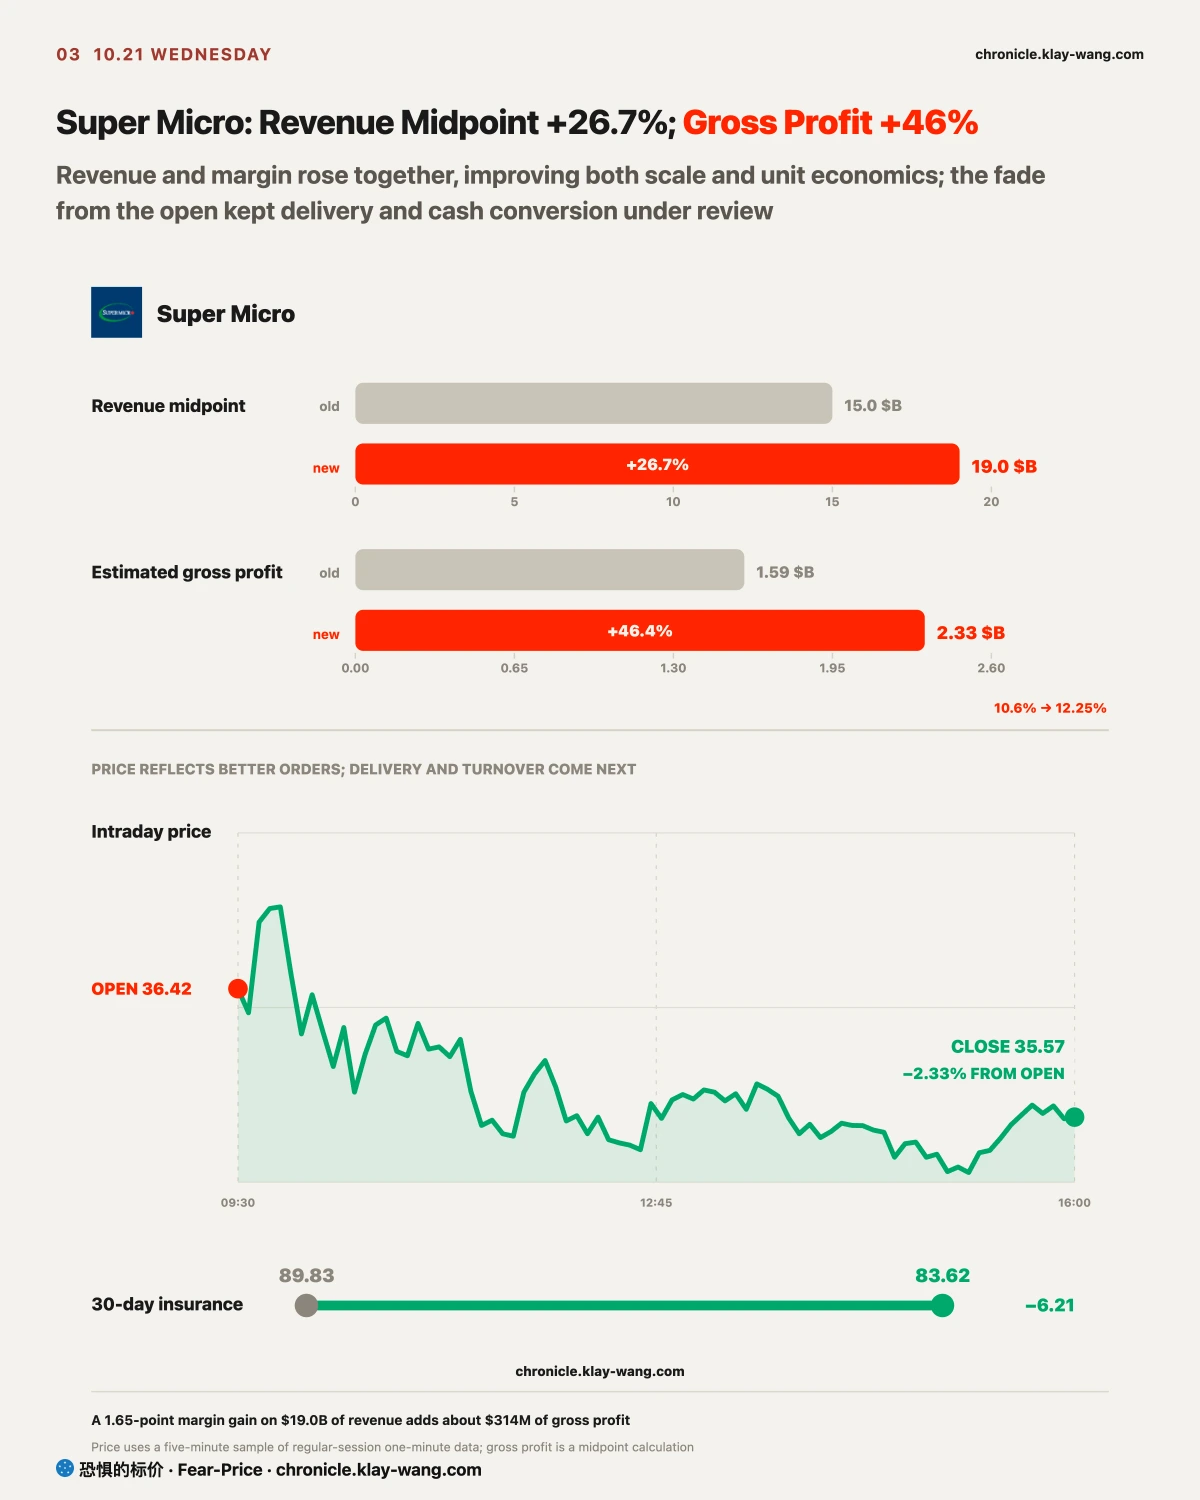
Super Micro lifted its preliminary fiscal first-quarter revenue range to $18.5 billion to $19.5 billion from $14.5 billion to $15.5 billion. The midpoint rose 26.7%. Gross-margin guidance increased to 12.0% to 12.5% from 10.4% to 10.8%.
Multiplying the midpoints puts estimated gross profit near $2.33 billion, up about 46.4% from $1.59 billion. The update improved both order scale and unit economics.
Server assembly carries thin gross margins. A 1.65-percentage-point increase in the margin midpoint applied to a larger revenue base explains the faster gross-profit growth. Product and customer mix must hold, while inventory and receivables cannot keep absorbing cash. Formal results that confirm revenue without confirming margin and working capital would weaken the quality of the order growth.
Shares opened at $36.42 and closed at $35.57, still 9.55% above the prior close. Thirty-day constant-maturity implied volatility fell to 83.62 from 89.83. The news retained value and event premium eased, while the fade kept delivery, customer concentration and working capital under review.
Two gaps matter more to a buy-side model. The $19.0 billion revenue midpoint was 16.9% above the pre-update consensus near $16.26 billion. Applying the 1.65-percentage-point margin improvement to the same $19.0 billion revenue base adds about $314 million of gross profit. That amount still has to pass through operating expense, interest, tax and share count before it reaches EPS. The next revision is to earnings estimates, inventory and receivables.
At the Oct. 21 close, Super Micro traded near 10.6 times trailing earnings, implying about $3.34 of trailing EPS. Dell, HPE and Vertiv traded near 27.2, 28.9 and 47.2 times. The Super Micro discount reflects thin margins, customer concentration and cash conversion. Holding gross margin above 12% without worse inventory or receivables would make an earnings-driven re-rating more plausible. Revenue growth with weaker cash conversion would preserve the discount.
Meta and Tesla: Different Cash Results and an Uneven Supply-Chain Confirmation
Meta revenue reached $64.601 billion, up 26% and above the $63.334 billion consensus. Ad impressions grew 10% and ad prices 14%, leaving the existing business capable of funding AI investment.
Operating income fell to $12.988 billion from $20.535 billion, including a $9.89 billion legal charge. A simple add-back produces $22.878 billion, above the prior-year figure. That arithmetic only separates the one-off charge and is not company non-GAAP guidance.
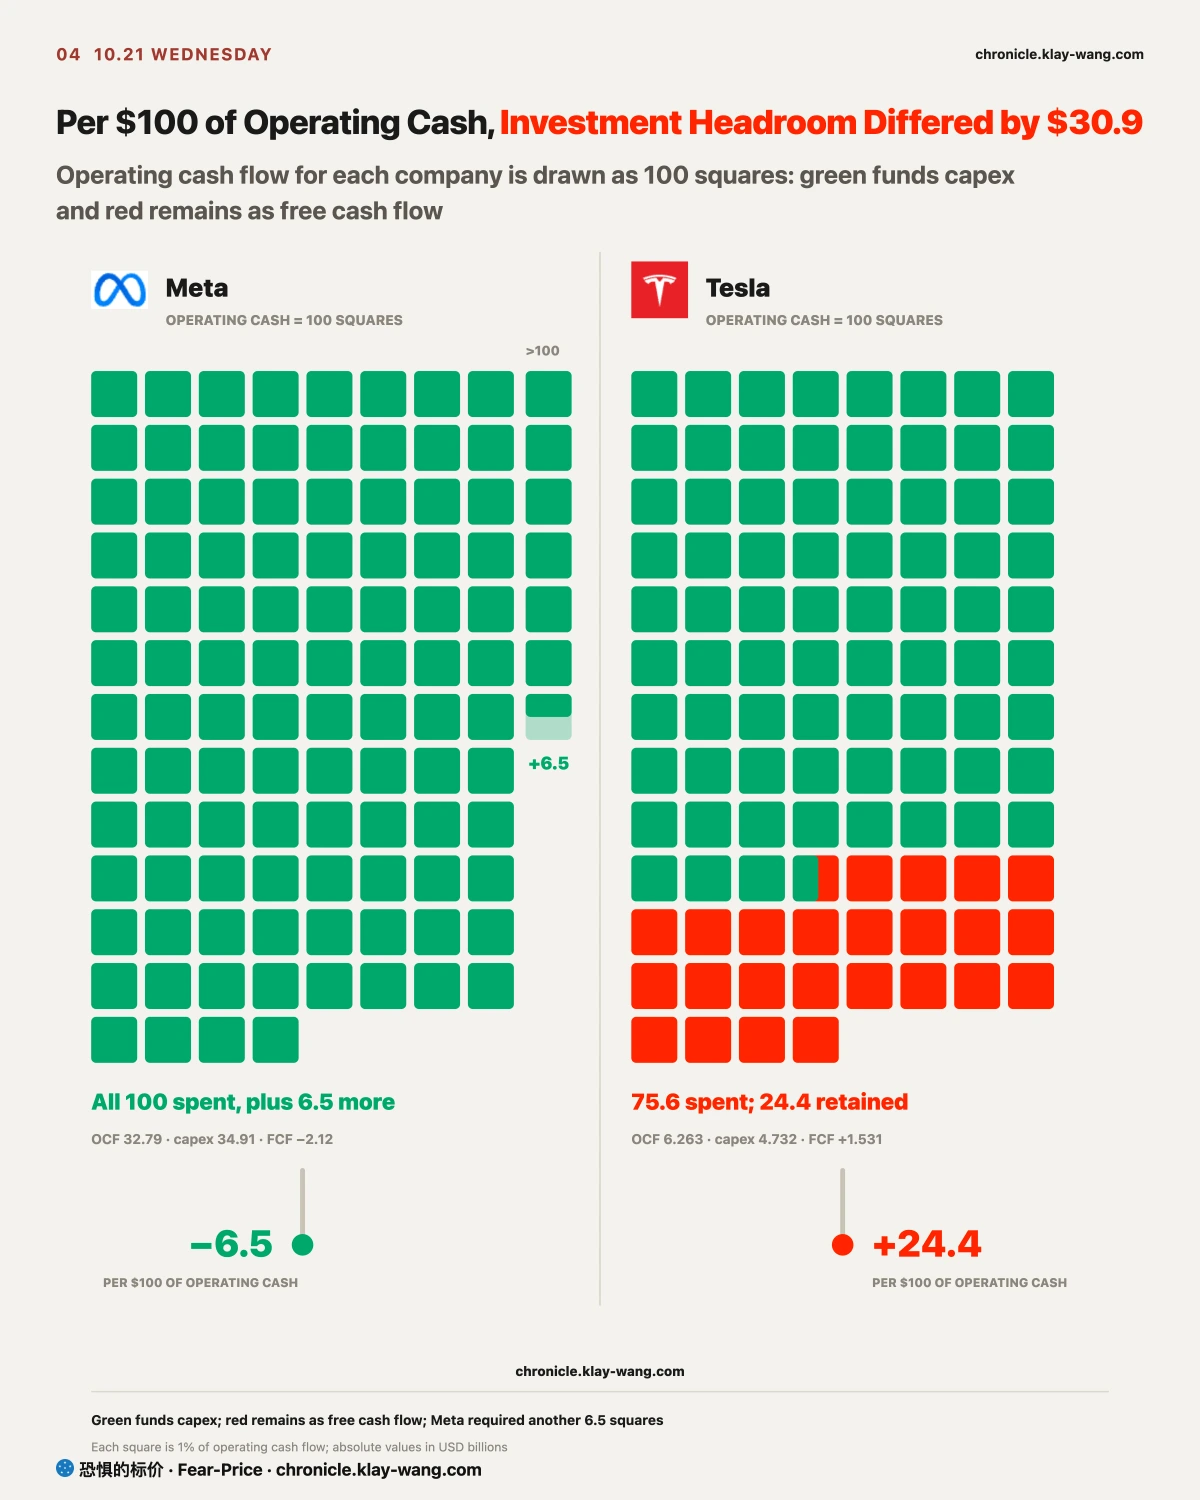
Meta generated $32.79 billion of operating cash flow and spent $34.91 billion on capex, leaving free cash flow at negative $2.12 billion. It raised the lower end of full-year capex guidance to $135 billion while keeping the $145 billion upper end.
Meta reported $3.83 of GAAP diluted EPS for the quarter and traded near 26.1 times trailing earnings, versus Microsoft at 29.6, Amazon at 20.9 and Alphabet at 16.8. This comparison is a pricing ruler for mature platform cash flows; the revenue models differ. The three cloud vendors sell compute directly. Meta first consumes compute inside ad ranking and recommendations, while Muse adds potential subscription, API and enterprise-service revenue. Muse is now present in the personal agent, developer models and enterprise platform, but a buy-side base case should wait for revenue, inference cost per user and enterprise contracts before treating it as core earnings.
Tesla generated $6.263 billion of operating cash flow and spent $4.732 billion on capex, leaving $1.531 billion of positive free cash flow. Net income attributable to common shareholders was $787 million and GAAP diluted EPS was $0.22. Tesla could fund quarterly investment from operating cash, but its trailing P/E near 401.1 times was far above the Meta multiple of 26.1. That price requires autonomy, software or robotics to enter the income statement at scale. If EPS and free cash flow lag, valuation duration becomes the central risk.
Meta reported after the close, so its release can inform after-hours repricing but not the regular session. Tesla rose 3.41% during regular trading, and after-hours information is not used to explain that move.
Upstream and downstream. Chips held, while debt-funded builders still required separate accounting.
Nvidia and AMD closed above their opening prices. Dell and HPE represented servers and enterprise deployment, while Vertiv represented power and cooling. Their gains showed that the order improvement extended beyond GPUs. Super Micro supplied server-order evidence, and Meta supplied customer-budget evidence.
Funding did not confirm the story as cleanly. The Dell spread stayed low and stable, while Oracle paid about 2.58 percentage points over Treasuries and CoreWeave about 10.09. Orders lift revenue; interest, depreciation and working capital decide how much cash reaches shareholders.
A later combination of technology leadership, wider credit spreads and stronger defensives such as insurers and banks would break the chain from demand to cash, and would suggest investors are chasing growth while adding protection.
What Comes Next: One Month for Profit, Three Months for Funding, LEAPS for Cash Payback
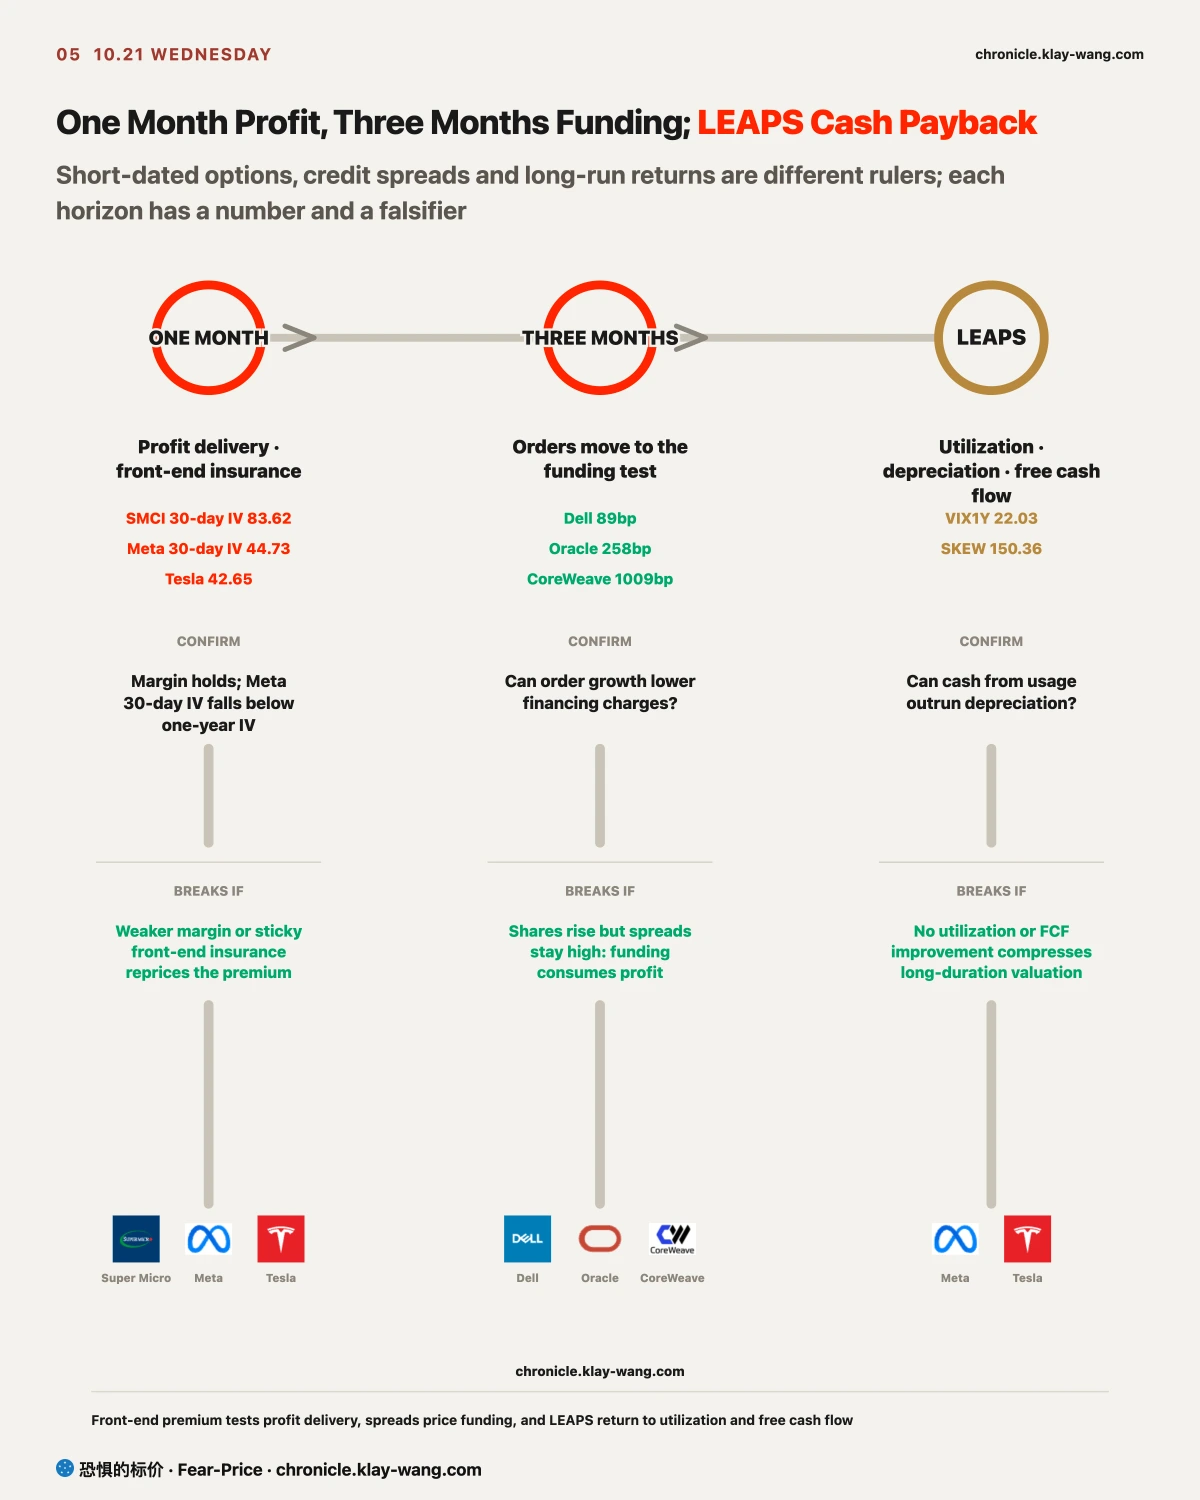
Over the next month, Super Micro must hold gross margin at 12.0% to 12.5% without worse inventory, receivables or operating cash flow. For Meta, a 30-day volatility reading that falls below one-year volatility after earnings would show that the event premium cleared. A persistent inversion would keep a short-term risk charge on capex and earnings delivery.
Over three months, watch the Dell, Oracle and CoreWeave credit spreads. Continued order growth with falling spreads would show that incremental profit is covering funding cost. Rising shares with stubborn spreads would leave creditor confirmation missing.
At the LEAPS horizon, meaning options that expire more than a year out, utilization, depreciation and free cash flow take over.
One-month implied volatility fell to 83.62 for Super Micro, 62.01 for Dell, 38.88 for Nvidia and 42.65 for Tesla. Near-term event insurance eased while one-year index insurance and SKEW stayed expensive.
The Meta Nov. 20 $700 call traded 7151 contracts, about one-third of existing open interest at 21627, so we do not treat it as evidence of a concentrated bullish Meta bet. The clearer evidence came from term structure. Before earnings, Meta 30-day implied volatility at 44.73 exceeded one-year volatility at 41.56, with an expected earnings-window move near 6.28%, concentrating the higher insurance charge around earnings.
What This Means for What You Hold
Orders and margin: Super Micro reported estimated gross-profit growth faster than revenue growth. Nov. 3 must confirm margin, working capital and operating cash flow.
Cash payback: Meta capex exceeded quarterly operating cash. Muse adds subscription, API and enterprise-service optionality, while inference cost and revenue still need to enter the model. Tesla covered capex with quarterly operating cash, but $0.22 of quarterly EPS and a trailing P/E near 401.1 times raise the delivery bar for autonomy, software and robotics.
Diffusion and funding: Nvidia, AMD, Dell, HPE and Vertiv confirmed demand across chips, servers and power systems. Oracle, CoreWeave and Nebius did not keep pace with hardware, and creditors did not broadly lower charges. Margin, delivery, inventory, debt and utilization remain the next checks.
Three Lines Worth Keeping
- Super Micro raised orders and margin together; whether a 10.6-times multiple re-rates depends on inventory, receivables and cash conversion.
- Meta uses ads and Muse to repay compute investment, while Tesla must deliver physical-product and software earnings into a roughly 401-times valuation.
- One-month protection eased while long-dated crash insurance stayed expensive; funding cost and cash payback take over after the event.
No investment advice. No direction calls. No market timing.