Small Caps Lagged the S&P 500 for Three Months. Should You Buy Them in the Fourth Quarter? · Week of October 19 to 23
Three Lines: Small Caps Rose 2% This Week, but the Two Conditions for Beating the S&P 500 Are Not Yet in Place
- The S&P 500 fell 0.4% this week and the Russell 2000 rose 2%; over three months small caps still lag the S&P 500 by 8.7 percentage points, and the index sits below its 200-day average.
- Over 38 years, buying small caps in late October and holding to year-end produced gains in 74% of years, but beat the S&P 500 in only 50% to 68% of them, with a median edge below 1 percentage point.
- In futures, the gain this week came mainly from leveraged funds covering about 5.4 billion dollars of shorts, while long-term asset managers added about 0.2 billion; two-year Treasury yields fell while high-yield spreads widened.
Fear-Price Index 67.3: The Index Barely Fell, Yet the One-Year Insurance Reading Rose 6 Points in a Week
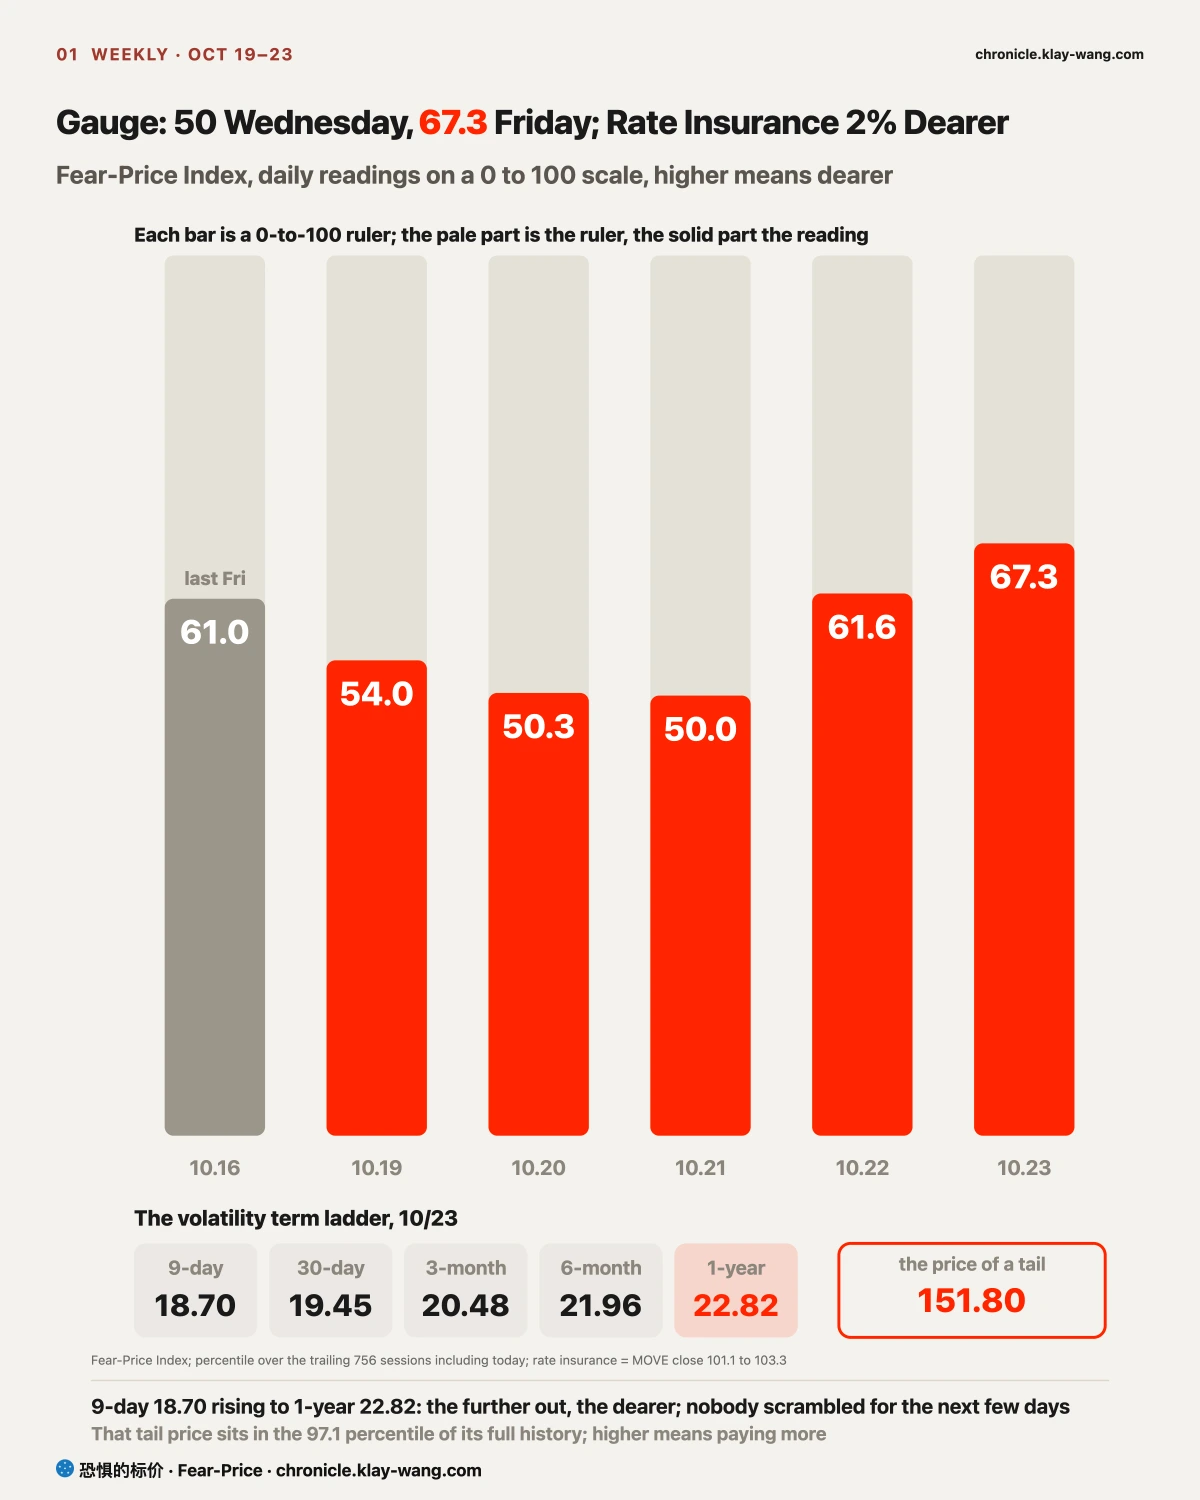
Fear-Price Index · 2026-10-23 · Reading 67.3/100: one-year volatility VIX1Y was 22.82, in the 67.3rd percentile of the past three years, where high means expensive. Daily ledger and definitions at chronicle.klay-wang.com · Please credit: Fear-Price Index · Fear-Price
The Fear-Price Index measures how expensive one-year downside insurance on US stocks is compared with the past three years; a higher reading means pricier. The reading rose from 61.0 last Friday to 67.3, after dropping to 50.0 on Wednesday and climbing 17 points on Thursday and Friday. The S&P 500 fell only 0.4% for the week, yet the one-year premium rose, and premiums from nine days to one year still rose the further out they went. Premiums for the next few days were not bid up; the rise was in the one-year premium. If you hold only index funds, one-year protection now costs more than on two-thirds of the days in the past three years.
The K Index was 1.079 (provisional), below the final 1.104 last Friday. The closer K gets to 1, the more people turn pessimism into paid protection; with Fear and Greed at 21.0 on Friday, VIX would need to rise above 21.0 for K to fall below 1. What followed each past break can be checked at chronicle.klay-wang.com/kindex.
[The Week] The S&P 500 Barely Moved and Small Caps Rose 2%, While the AI Supply Chain Fell All Week
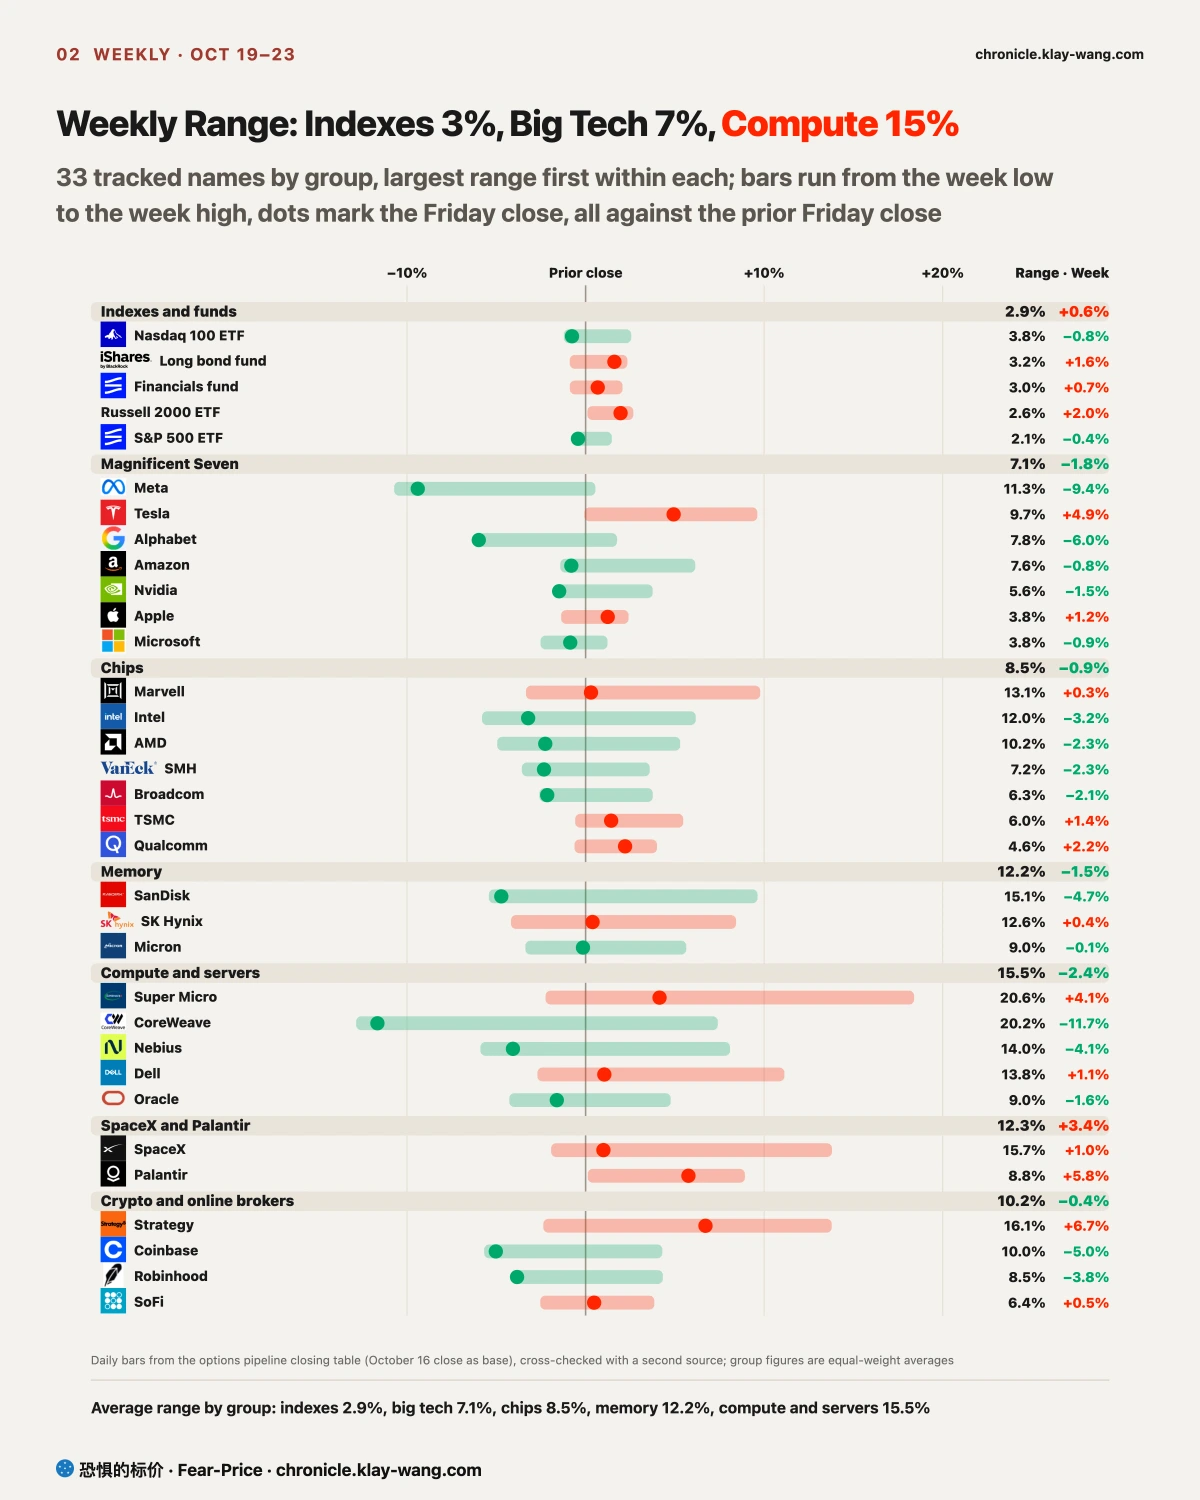
Over the week the index barely moved: the S&P 500 and the Nasdaq 100 each fell less than 1%, small caps rose 2%, and financials and the long-term Treasury fund also rose. The members underneath reshuffled. The biggest moves were almost all in the AI supply chain. By group, the average weekly range was 2.9% for indexes, 7.1% for big tech, 8.5% for chips, 12.2% for memory and 15.5% for compute and servers: the closer to borrowing for data centers, the wider the range, and the harder it is on the nerves. CoreWeave fell 11.7% for the week, and Meta and Alphabet 6% to 9%.
Our daily notes covered the AI supply chain day by day this week, and our basic view has not changed: the market is voting on the AI supply chain with its feet. Tesla cut capital spending and rose, Meta spent more than its operating cash flow and planned new shares and fell, and the segments furthest from end-customer cash and most reliant on borrowing fell the most. On Friday CoreWeave borrowing cost fell a little, while spreads for higher-rated names such as Meta and Broadcom widened, and the 10-year Treasury yield fell from 5.09% to 5.00% over the week.
What we have not written about before is how small caps, more sensitive to borrowing costs, behave when rates fall. The Russell 2000 rose this week, yet it lagged the S&P 500 by 8.7 percentage points over three months, sits 9.5% below its August 14 high and is roughly even with the S&P 500 for the year. Many are asking whether the fourth quarter is the time to buy small caps. The next four sections look at seasonality, rates and credit, who is trading, and whether they are cheap.
[Seasonality] Small Caps Usually Rise Into Year-End, but Their Edge Over the S&P 500 Is Thin
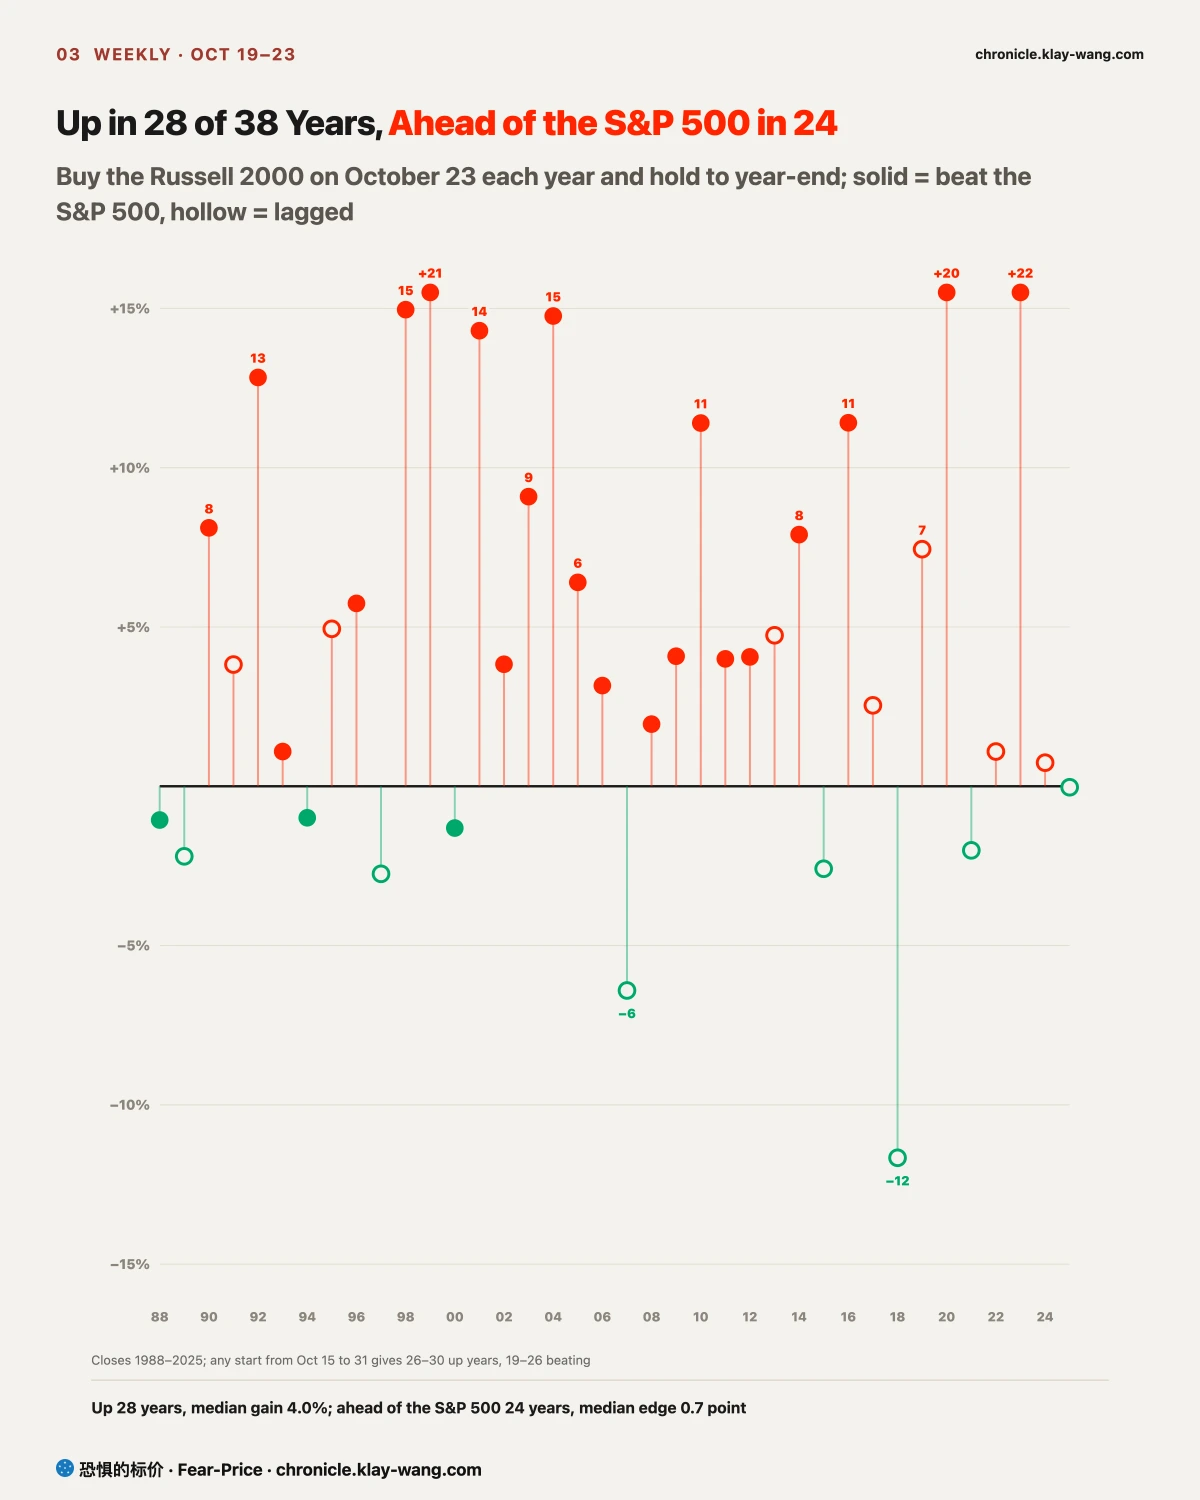
Buying the Russell 2000 on October 23 each year from 1988 to 2025 and holding to year-end produced gains in 28 of 38 years, with a median gain of 4%. The months agree: November and December are the two best months of the year for small caps on average, each up more than 2%, while August and September are negative on average.
Over the same 38 years, measured against the S&P 500, small caps came out ahead in only 24, with a median edge of 0.7 percentage point. That edge is also unstable: moving the start date between October 15 and October 31 swings the number of winning years between 19 and 26 and the median edge between minus 0.3 and 0.8 percentage point, while the number of up years stays between 26 and 30.
The two sets of numbers differ because the year-end rally lifts the whole market. Small caps move more than the S&P 500 in both directions, so when large caps rise they usually rise too, which keeps the up years steady; beating the S&P 500 depends on the earnings and borrowing conditions of small companies themselves, which change every year, so shifting the start by a few days changes the answer. To see how small 0.7 point is, compare this week: IWM beat SPY by 2.4 percentage points in a single week, more than the median edge over ten weeks of history.
The data give the same answer on catch-up. Since 1988 the Russell 2000 has lagged the S&P 500 by 8% or more over three months 27 times; small caps rose over the next three months 21 times but beat the S&P 500 only 12 times. Moving averages say the same: the Russell 2000 closed Friday at 2775.90, 0.9% below its 200-day average; of 52 times it regained the line after eight or more sessions below, it beat the S&P 500 three months later 54% of the time, and 48% of the time it fell back below within a month.
History does not repeat itself, but it often rhymes (commonly attributed to Mark Twain, though the source is disputed). For small caps, the year-end gain repeats in most years, while beating the S&P 500 differs from year to year. If you want to buy small caps in the fourth quarter and hold to year-end, most years in history made money; if what you want is to beat the S&P 500, seasonality cannot answer that; rates, credit and who is buying can.
[Rates and Credit] Treasury Yields Fell, High-Yield Spreads Widened
Small companies carry lower ratings and pay more than large ones to borrow from banks and bond markets, so small caps are especially sensitive to two prices. One is the two-year Treasury yield, which reflects what the market expects from the Fed over the next two years and and the rates small companies pay to borrow or refinance follow that expectation; the other is the high-yield spread, the extra interest over Treasuries that lenders charge lower-rated companies.
Measured weekly since 2022, both prices are linked to how small caps do against the S&P 500, but neither link is strong. In weeks when the two-year yield fell, small caps usually led; in weeks when high-yield spreads widened, they usually lagged, and that link is a little tighter. The correlations are minus 0.21 and minus 0.27 on a scale where 1 is perfect, so neither is enough alone; it counts when both move in the helpful direction together.
This week they moved in opposite directions. The two-year yield fell from 4.74% to 4.69% and the 10-year from 5.09% to 5.00%, so expected borrowing costs moved down; the high-yield spread rose from 3.31% to 3.40%, so lower-rated companies had to pay more to issue bonds. On Thursday, when Treasuries rallied hard, the high-yield spread widened 0.13 percentage point in one day: Treasuries rallied while high-yield bonds lagged, so borrowing got relatively dearer for lower-rated companies.
The three-month backdrop is rate hikes. The Fed resumed hiking in September, and the two-year yield rose 0.5 percentage point over three months, the same stretch in which small caps lagged the S&P 500 by 8.7 points. On Thursday the market pushed the next hike from December to January, and the two-year yield fell from Thursday on.
That is why the Fed meeting on October 27 and 28 matters more for small caps than big tech results. If the two-year keeps falling after the meeting and the high-yield spread returns to around 3.3%, both prices favor small caps and the conditions for them to lead are in place; if the two-year falls while spreads keep widening, the market is worried about the economy and defaults, and the small-cap gain of this week is unlikely to hold.
[Who Is Trading] The Gain This Week Came Mainly From Futures Short Covering; Long-Term Money Has Not Followed
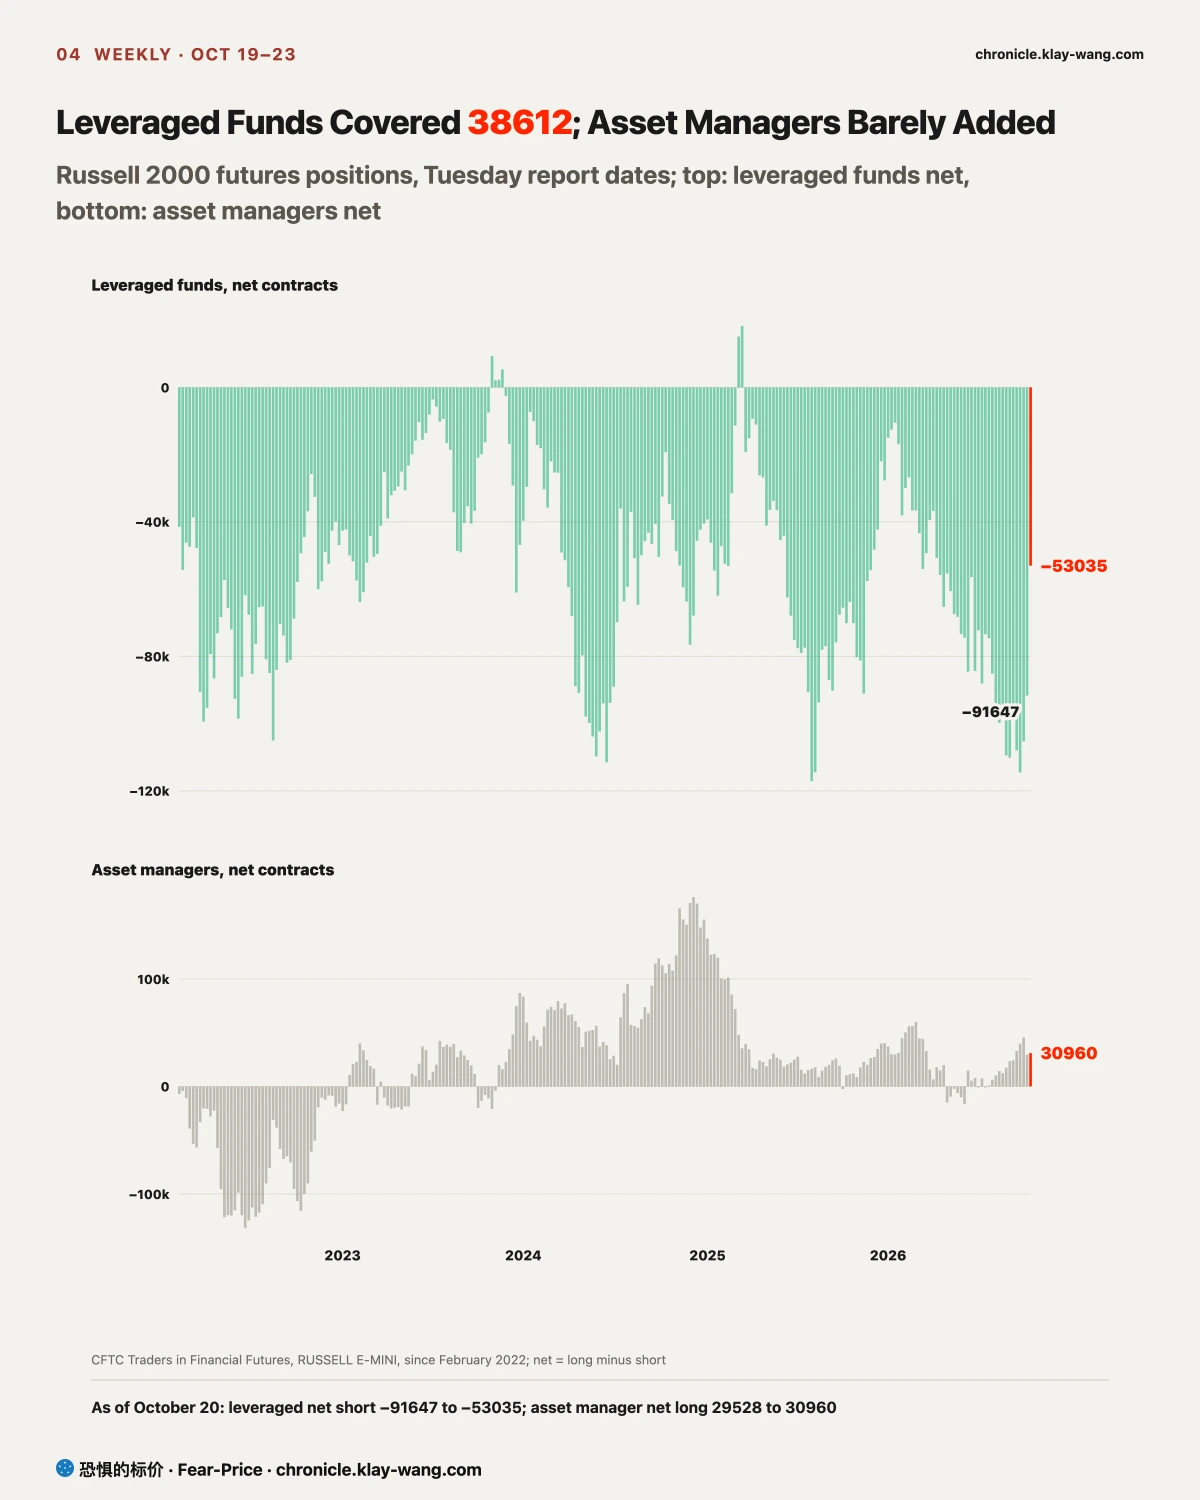
Two groups dominate Russell 2000 futures. Leveraged funds are hedge funds and quant funds, and many of their shorts hedge long positions in individual stocks; asset managers are pensions and mutual funds, long-term money whose positions change slowly.
In the CFTC report as of October 20, the net short of leveraged funds fell from 91600 to 53000 contracts, 38600 covered in a week. Each contract is the Russell index times 50 dollars, about 139000 dollars, so the shorts covered were worth about 5.4 billion dollars; the week before, their short was near the deepest 10% since 2022. The net long of asset managers rose only from 29500 to 31000 contracts, about 0.2 billion dollars.
Covering a short means buying futures back, which pushes prices up for a while; how far depends on whether long-term money follows. Since 2022, after the weeks when leveraged funds were most short, the Russell 2000 usually fell over the next month, by a median 3.8%, and was roughly a coin toss over three months; those samples cluster in 2022, so treat them as background.
In options, small-cap downside insurance has cost more than insurance on the S&P 500 every day since we started recording at the end of August. IWM one-year premium rose from 23.10 to 23.72 this week, 5 points above 18.65 for the S&P 500. IWM rose 2% for the week and its one-year premium rose too, so people buying the stock were also buying protection and are not confident in the rally; the one-month premium, at 20.27, is below one-year, so nobody is scrambling for the next few weeks.
Market maker positioning amplifies the swings. Below 284 dollars on IWM, market makers hedge in the direction of the move, selling into declines and buying into rallies; the heaviest put strike is 270 and the heaviest call strike 280. IWM closed Friday at 275.75 dollars, between the two and below 284.
Put together, the gain this week rested mainly on short covering, long-term money did not follow, and options traders are still paying extra to insure small caps. The next positioning report comes out on October 30; if asset managers keep adding to their net long, the rebound has long-term buying behind it; if only leveraged funds keep covering, IWM is likely to stop rising near 280, its heaviest call strike.
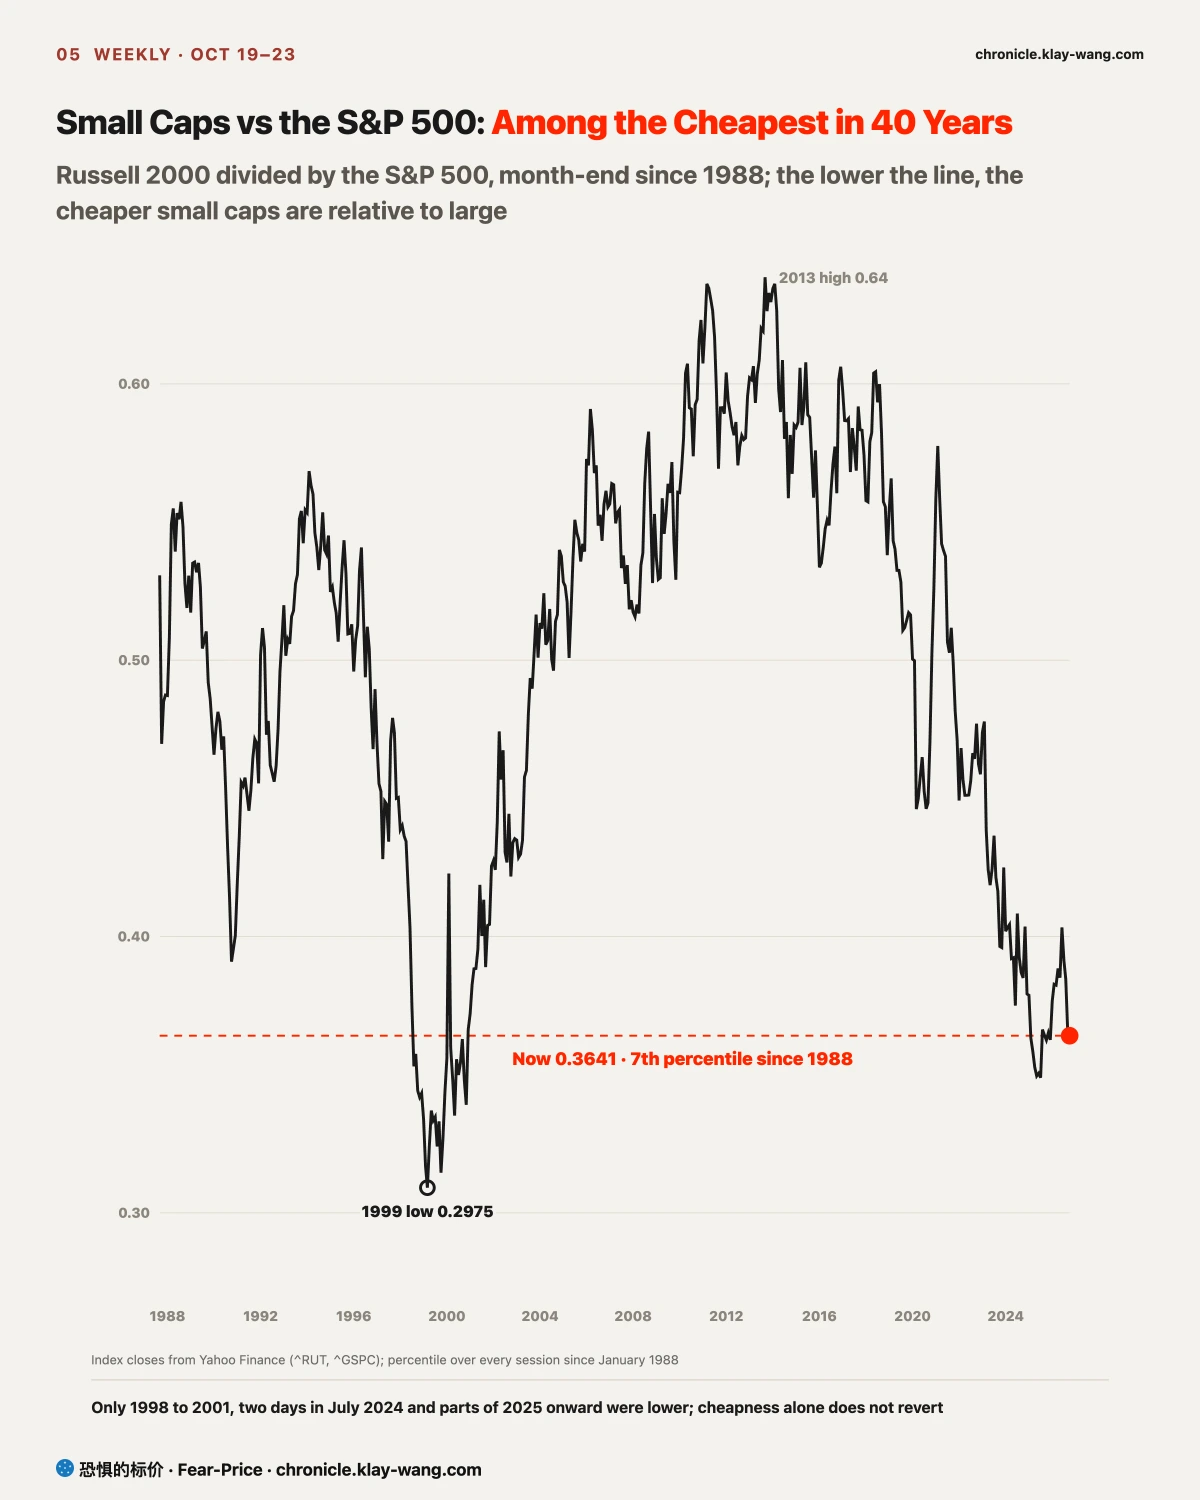
[Cheap or Not] Small Caps Are Cheap Relative to the S&P 500, but a Low Valuation Needs Rate Cuts and Better Earnings to Turn Into Gains
The ratio of the Russell 2000 to the S&P 500 sat in its 7th percentile since 1988 on Friday. Only 1998 to 2001, two days in July 2024 and parts of 2025 onward were lower.
A low ratio can mean small caps are undervalued, or that their earnings simply lag those of large companies and the discount is deserved. The 1998 to 2001 stretch is a useful comparison. From August 1998 to November 2000 the ratio stayed below the current level for more than two years while money chased big tech; after the dot-com bubble burst and the Fed cut rates repeatedly in 2001, the ratio rose from 0.37 to 0.57 by 2006, and small caps mostly led for more than five years. That time the ratio stayed low for more than two years, and it recovered as rates were cut and big tech earnings fell.
Cheapness does not revert on its own. South Korea offered a counterexample this week: according to Bloomberg data cited by Wallstreetcn, the forward price-to-earnings ratio of the KOSPI fell below 5, the first trillion-dollar market to reach that level since Bloomberg data began in 2006, and money was still leaving. When investors do not believe earnings will last, valuations can stay low for a long time.
For small caps to be repriced this time, the same two things are needed: Treasury yields and high-yield spreads falling together to make borrowing cheaper for small companies, and long-term money buying again. Right now Treasury yields are falling, high-yield spreads are widening and long-term money has not moved; a low valuation is a condition, not yet a reason to buy.
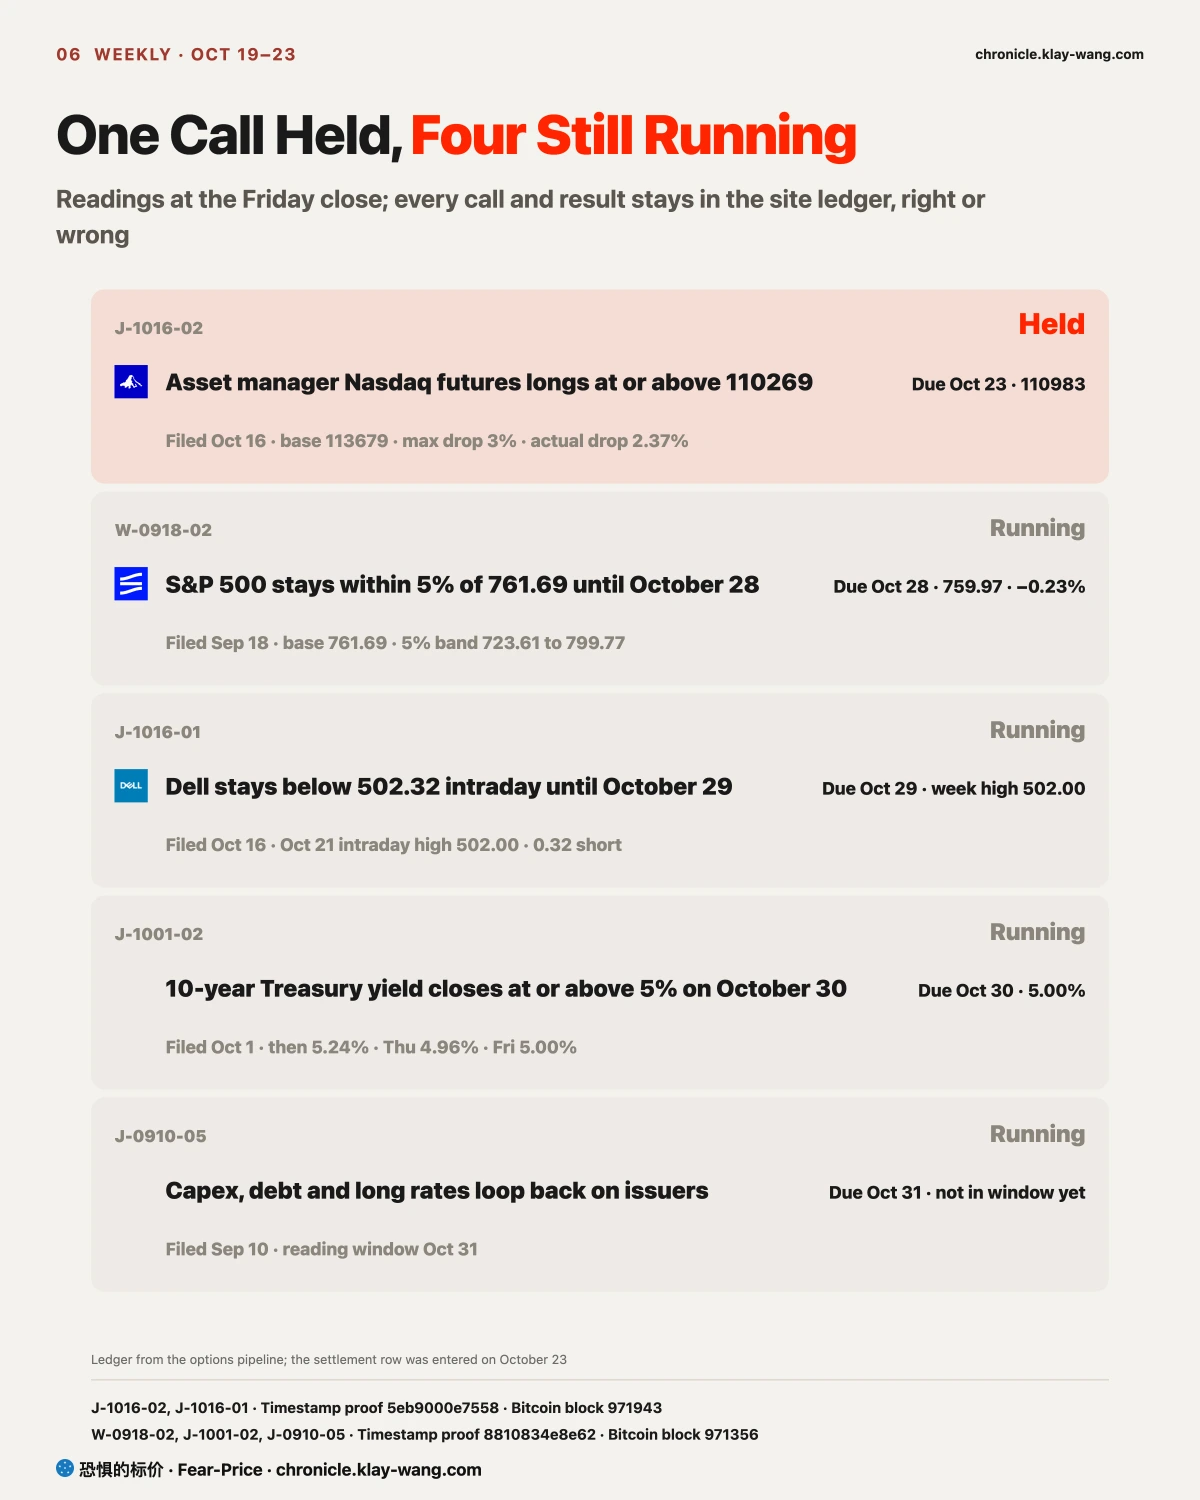
[Right and Wrong] One Call Settled as Held; Four Still Within Their Holding Range
A call made two weeks ago settled on Friday and held. On October 16 we wrote that asset manager longs in Nasdaq futures would be at or above 110269 contracts in the report for October 20; the report showed 110983. While chips were sold early in the week, long-term money did not run.
Readings at the Friday close on the calls still running follow. The S&P 500 is 0.2% from the September 18 level of 761.69, within the holding range of the call that settles October 28.
Dell reached 502.00 intraday this week, only 0.32 dollar short of 502.32, still within the holding range for October 29. The 10-year Treasury yield closed at 4.96% on Thursday and 5.00% on Friday, right at the holding threshold of the October 30 call.
We also got things wrong this week. The October 20 and 21 notes said SKEW, the price of insurance against deep declines, rose; official Cboe data showed it fell on both days, and the October 22 note corrected it. The October 19 note said the chip rebound was not yet safe to buy, and chips fell another 6% on Thursday; that call was right. Every call and result is in the judgment ledger at chronicle.klay-wang.com/options. If you acted on any call, check back on its settlement day.
[Holdings] What This Means for What You Hold
If you hold S&P 500 or Nasdaq 100 ETFs: 10000 dollars in SPY lost about 43 dollars this week and QQQ about 76 dollars; their weekly ranges were only 2% to 4%; the big moves were in the stocks inside the index. Next week, watch whether SPY holds 760 and QQQ holds 700.
If you hold the Magnificent Seven: Meta fell 9.4% this week, Alphabet 6%, and Apple hit a record. Microsoft and Alphabet report on October 28 and Amazon on October 29; watch the gap between capital spending and operating cash flow, and whether borrowing costs keep rising after results.
If you hold memory and chips: SanDisk had a weekly range of 15%, SK hynix 12.6% and Micron 9%. SanDisk reports on October 29; Micron premiums are back to normal, but a single-day rebound is not a bottom until it holds on higher volume.
If you hold SpaceX: its weekly range was 15.7% and closed up 1%; its borrowing cost rose 0.59 percentage point in a week, the most among the 14 AI bond issuers we track. Until the spread stops widening, new bullish option positions are not evidence that the stock has bottomed.
If you want to buy small caps in the fourth quarter: historically, buying in late October and holding to year-end produced gains in 74% of years; to beat the S&P 500, first watch whether the two-year yield keeps falling after the Fed meeting and whether the high-yield spread can return to around 3.3%, then whether asset managers keep adding in the October 30 positioning report. On IWM, the 270, 280 and 284 levels matter more than the daily moves.
Dates to Watch Next Week: For Small Caps, the Fed Meeting Matters More Than Platform Results
- October 27 (Tuesday): first day of the Fed meeting; Robinhood and SoFi results.
- October 28 (Wednesday): Fed decision; Microsoft and Alphabet results; whether the S&P 500 is still within 5% of 761.69 (the September 18 call settles).
- October 29 (Thursday): September personal consumption expenditures price index; Amazon, Intel, SanDisk and Coinbase results; the Dell call settles.
- October 30 (Friday): whether the 10-year closes at or above 5% (the October 1 call settles; 5.00% on Friday); the CFTC positioning report as of October 27, to see whether asset managers keep adding to Russell longs.
Three Lines Worth Keeping This Week
- Buying small caps in late October and holding to year-end made money in 74% of the past 38 years, but the median edge over the S&P 500 is only 0.7 point, less than the gap in this single week.
- For small caps to lead, the two-year Treasury yield and the high-yield spread both need to fall; this week one fell and the other widened, so watch them after the Fed meeting.
- The gain this week came mainly from leveraged funds covering about 5.4 billion dollars of futures shorts, while long-term asset managers added only about 0.2 billion; the low valuation has not yet drawn long-term buying.
No investment advice. No direction calls. No market timing.